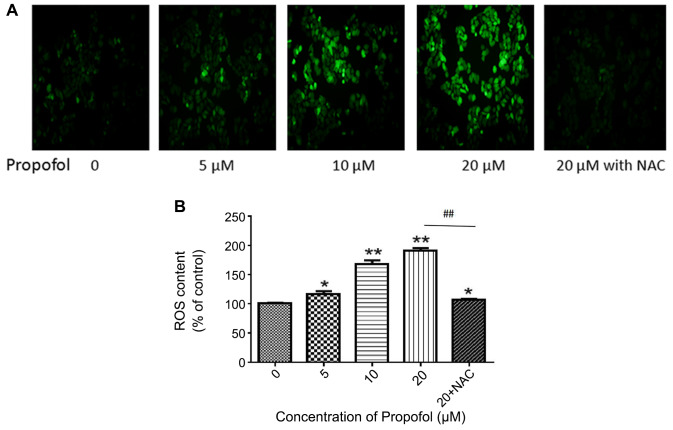
Figure 2.
ROS generation in MDA-MB-468 cells is increased following propofol exposure. (A) Intracellular ROS production in MDA-MB-468 cells was measured using a DCF-DA assay. MDA-MB-468 cells were treated with PBS (control) or propofol (5, 10, 20 and 20 µM + NAC) for 24 h. Cellular ROS production was observed using an inverted fluorescence microscope. (B) Quantification of ROS production following propofol treatment. Data are presented as the mean ± SD (n=3). *P<0.05 and **P<0.01 vs. the control group. Compared with the 20 µM group, the 20 µM + NAC group showed a significant difference (##P<0.01). ROS, reactive oxygen species; NAC, N-acetyl-L-cysteine.

