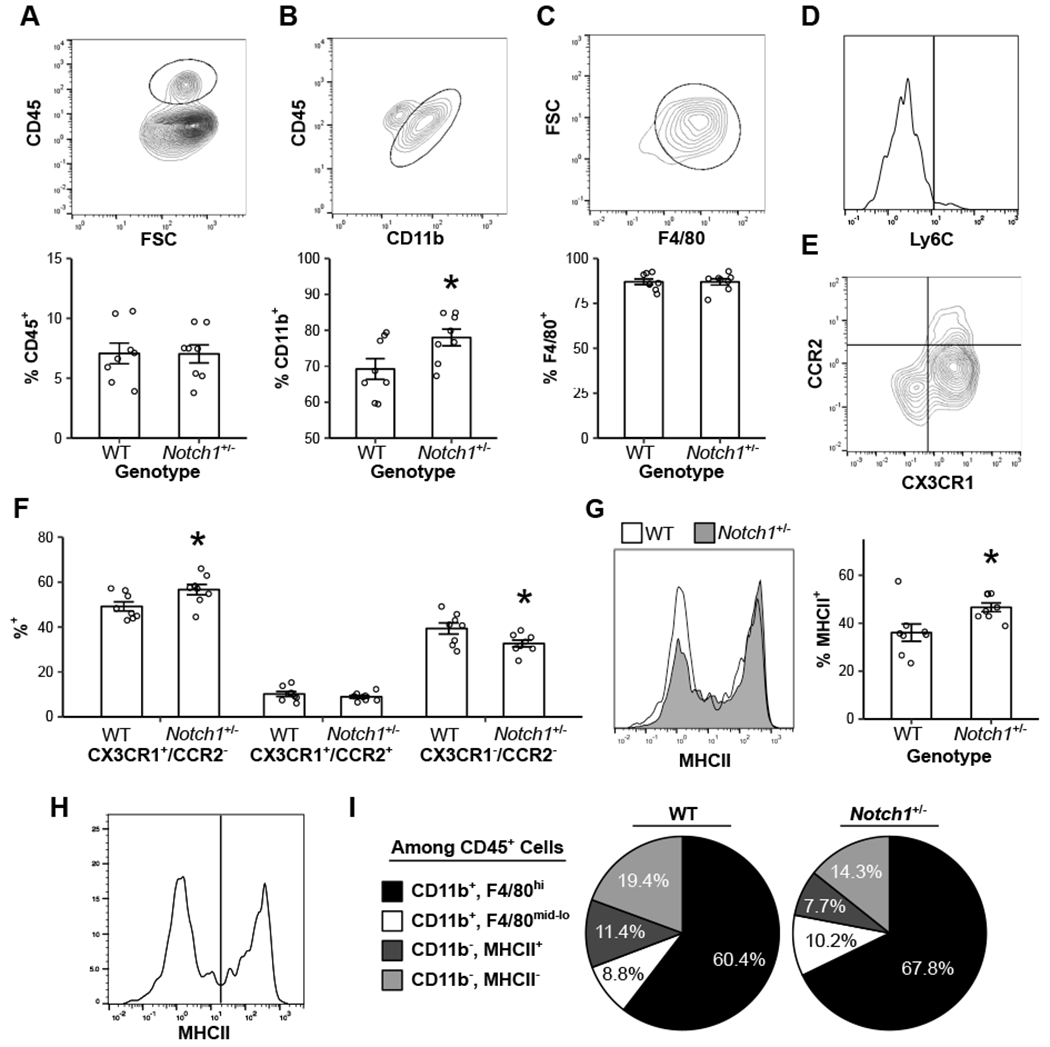
Figure 1. Notch1+/− murine valves have increased macrophage polarization.

Flow cytometry was performed on both WT and Notch1+/− aortic valves for CD45 (A), followed by CD11b (B), then F4/80 (C). Macrophages were characterized by Ly6C expression (D), CX3CR1 and CCR2 expression (E, F), and MHCII expression (G, outline = WT; gray fill = Notch1+/−). Non-myeloid hematopoietic cells were grouped by MHCII expression (H), and all cell types were plotted as average percentage of the total CD45+ population (I). Bar plots represent mean ± s.e.m (A-C, F, G). Representative flow plots are of WT animals (A-E, H). N = 8 biological replicates. *P < 0.05 by two-tailed t test.
