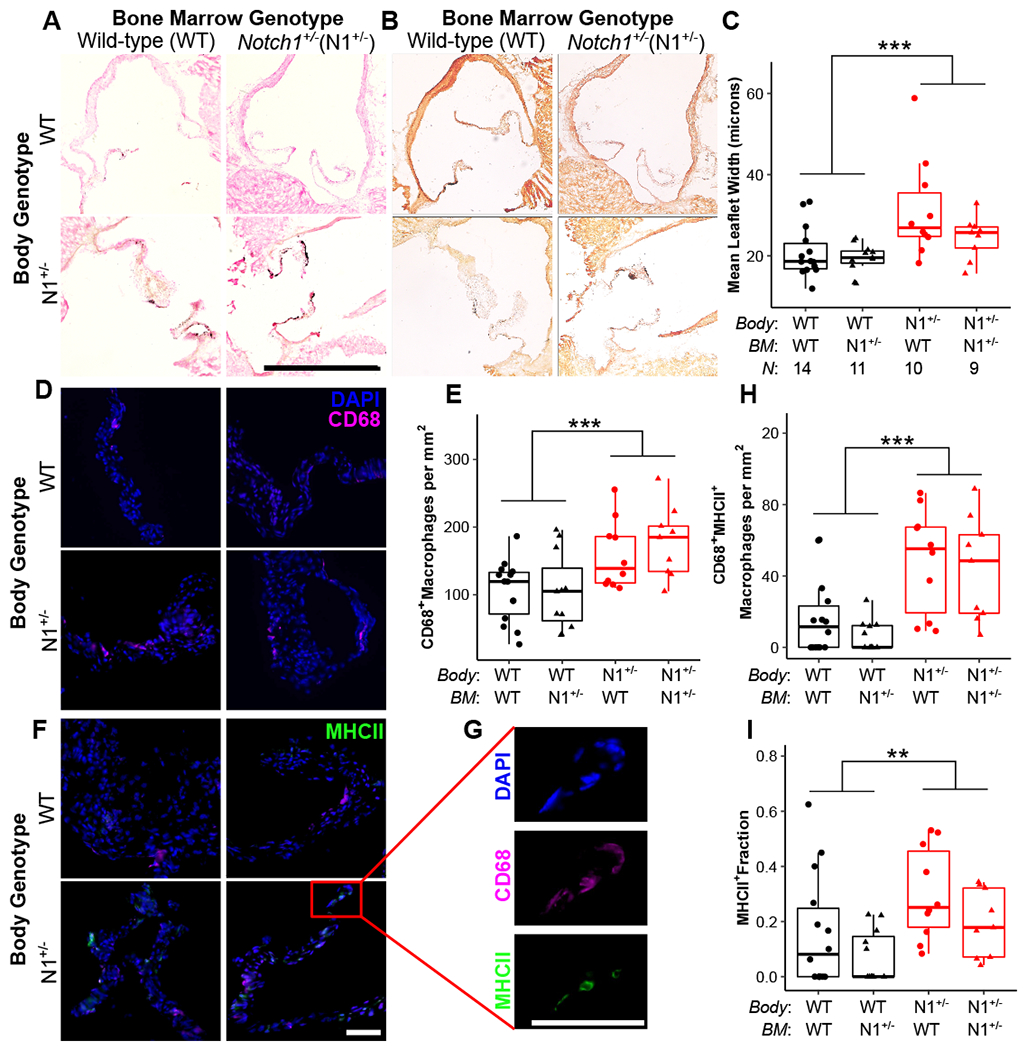
Figure 2. Notch1+/− valve cells drive aortic valve disease and macrophage infiltration and maturation in vivo.

Following bone marrow transplant, aortic valves from Notch1+/− (N1+/−) and wild-type (WT) mice were assessed for calcification (A, B), thickness (A, C), macrophage infiltration (D, E), and macrophage maturation, as measured by MHCII positivity (F, G, H, I). (A) Aortic valves are stained for histology and calcification by von Kossa and (B) Alizarin Red; scale bar = 1 mm. (C) Leaflet thickness is plotted as mean width across the entire section. (D, F, G) Aortic valves are stained by immunofluorescence for DAPI (blue), CD68 (pink), and MHCII (green); scale bar = 100 μm. (E, H) Macrophage data is plotted as cells per mm2 of tissue. Boxplots represent 25th, 50th, and 75th percentiles. All data were analyzed by two-way aligned rank transformed ANOVA.37 **P < 0.01, ***P < 0.001. N = biological replicates, and is the same across panels. BM = bone marrow.
