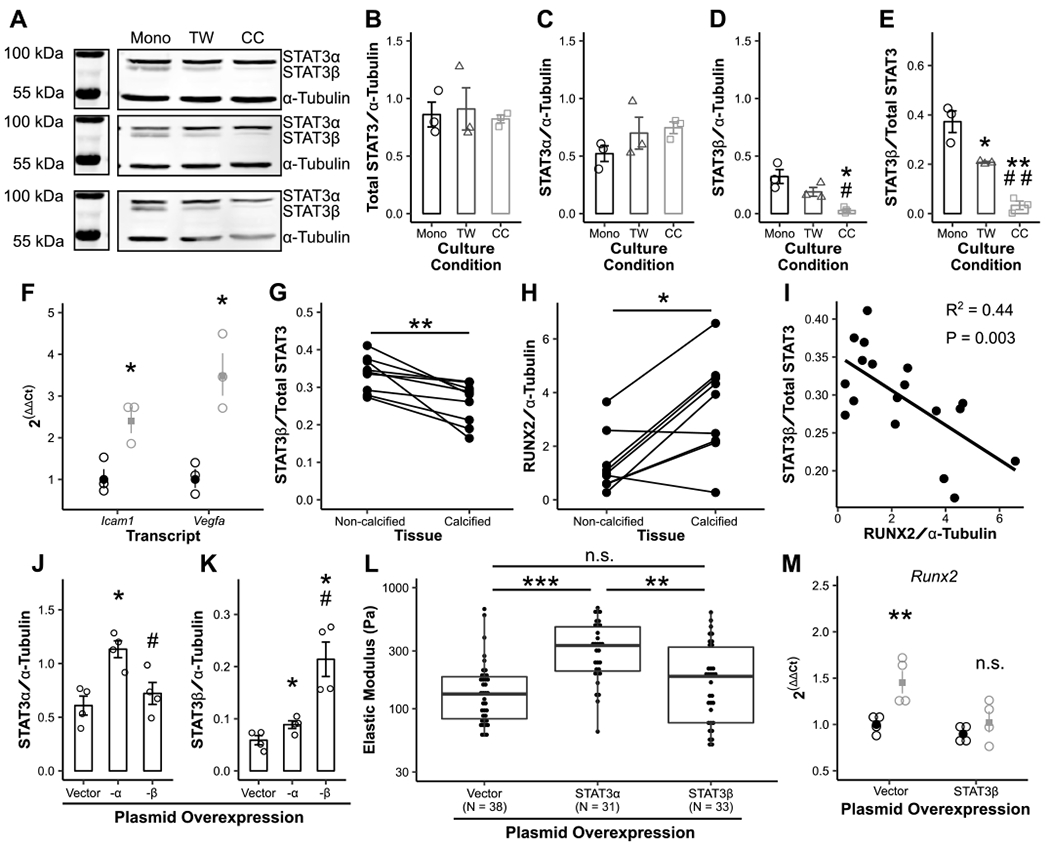
Figure 5. STAT3 splicing is altered in calcified human aortic valves and murine aortic valve cells.

Overall STAT3 expression (A, B), STAT3α expression (C), STAT3β expression (D, E), and expression of STAT3-associated transcripts (F) across 3 biological coculture replicates (black = monoculture [Mono], gray = Transwell [TW], light gray = coculture [CC]). STAT3β and RUNX2 expression was assayed by Western blot in human aortic valves divided into calcified and non-calcified tissue (G-I, N = 9). Plasmid overexpression of STAT3α and β was performed (J, K, N = 4), and cellular stiffness measured by micropipette (L). Overexpression of STAT3β was performed prior to coculture and cocultures assayed for Runx2 transcription (M, N = 4). Bars and dot plots represent mean ± s.e.m. Boxplots represent 25th, 50th, and 75th percentiles. Data were analyzed by one-way ANOVA followed by two-tailed t tests with Holm-Sidak corrections on densitometry data (B-E, J, K) or untransformed ΔCt values (F, M); paired Mann Whitney U tests (G, H); linear regression (I); or Kruskal-Wallis followed by Mann Whitney U tests with Holm-Sidak corrections (L). *P < 0.05, **P < 0.01, ***P < 0.001 from monoculture AVICs (D-F, M), non-calcified aortic valve tissue (G, H) or vector control (J, K); #P < 0.05, ##P < 0.01 from Transwell AVICs (D-E) or STAT3α transfection (J, K). N = biological replicates (B-K, M) or tests of individual cells across 3 biological replicates in 2 independent experiments (L).
