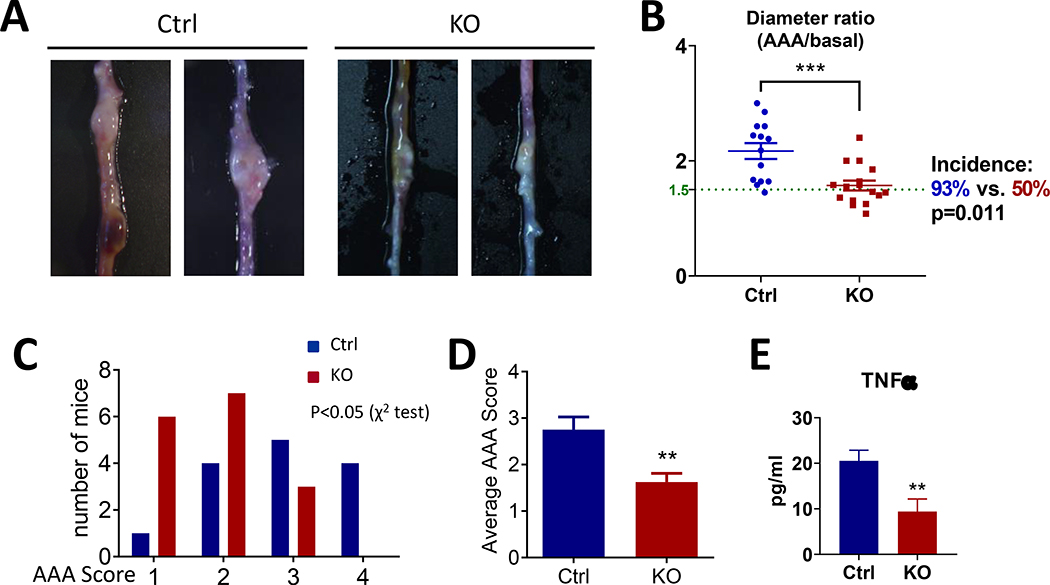
Figure 5. Effects of myeloid cell Bmal1 deletion on AngII-induced abdominal aortic aneurysm formation.
(A) Representative images of AAAs in Ctrl and KO group. (B) The ratio of maximal diameter of the abdominal aorta to basal diameter (Student’s t-test, *** p<0.001) and the incidence of AAA (above the green line, ratio>1.5, χ2 test). (C) Comparison of mice number of the specific classification of aneurysms. (D) The average AAA score (Student’s t-test, ** p<0.01, n=14–16). (E) Plasma level of TNFα (Student’s t-test, **p<0.01, n=12–15).

