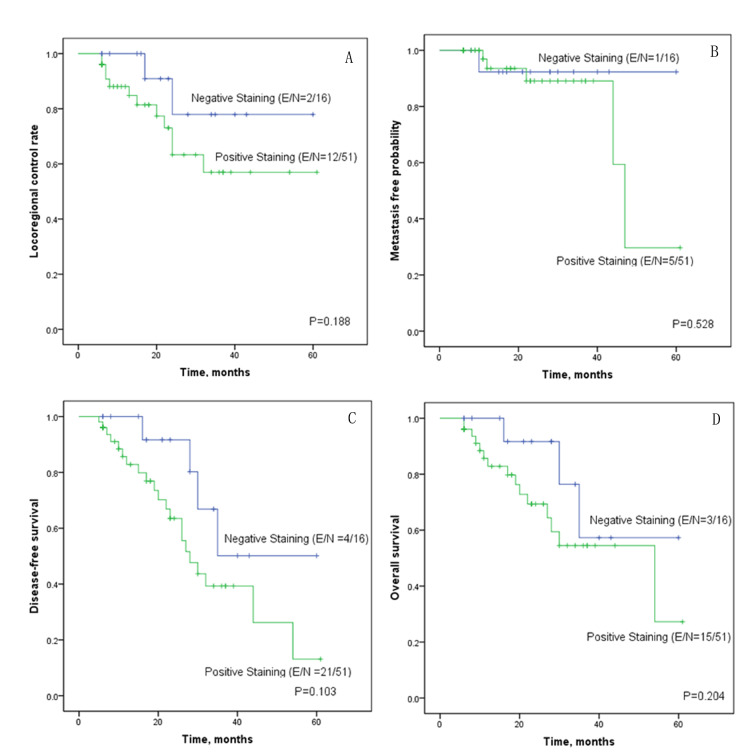
Figure 3.
Kaplan-Meier survival plots for patients with hypopharyngeal squamous cell carcinoma. Survival plots show (A) locoregional control rate, (B) distant metastasis-free probability, (C) disease-free survival rate and (D) overall survival rate according to collagen type I α 2 staining results. E/N indicates the number of events/total number of patients. The number of events refers to the number of the cases having locoregional relapse (A), distant metastasis (B), locoregional relapse/distant metastasis/death (C), and death (D), respectively.

