
Figure 2. Ancestry-associated differences in immune response are under genetic control.
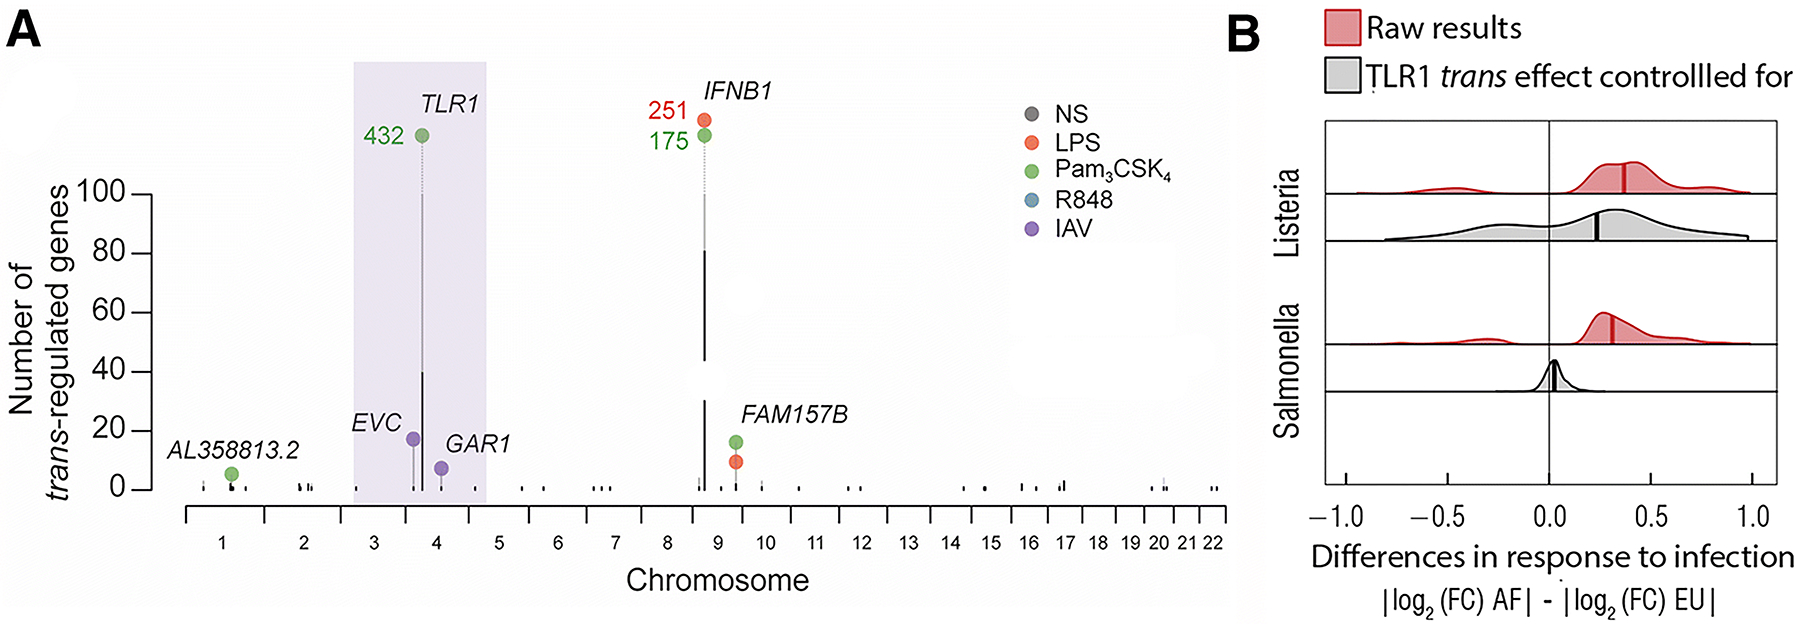
A) Manhattan plot representing the number of trans-regulated genes (y-axis) in monocytes. The different colors represent the conditions under which gene expression levels were measured: NS – non-stimulated; LPS – lipopolysaccharide (TLR4 agonist); Pam3CSK4 (TLR2 agonist); R848 (TLR7/8 agonist); IAV (flu virus). The purple box highlight the non-synonymous variant in TLR1 that regulates in trans over 400 genes in response to Pam3CSK4. B) Effect of the TLR1 trans-eQTL, rs5743618, on genome-wide distributions of inter-population response differences to Listeria, Salmonella infection of macrophages. The x-axis represents the absolute difference in the log2 fold change response to Listeria infection (top panel) and Salmonella (bottom panel) between European and African individuals. Positive values indicates that the transcriptional response was stronger among African ancestry individuals, whereas a negative value indicates a stronger response among European ancestry individuals. Regressing out the effect of rs5743618 (gray distributions) reduces differences between populations, suggesting that the weaker proinflammatory response observed in Europeans is in part explained by this single trans-eQTL.