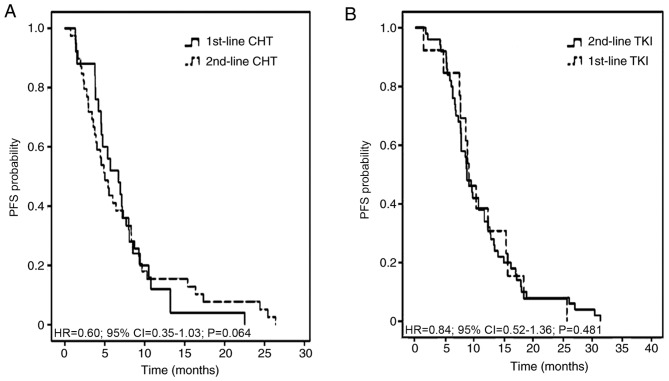
Figure 4.
Kaplan-Meier curves exhibiting 1st- and 2nd-line PFS time in patients who received either 1st-line CHT/2nd-line TKI or 1st-line TKI/2nd-line CHT strategies. (A) 1st-line CHT and 2nd-line CHT. (B) 1st-line TKI and 2nd-line TKI. TKI, tyrosine kinase inhibitor; CHT, chemotherapy; HR, hazard ratio; CI, confidence interval; PFS, progression-free survival.

