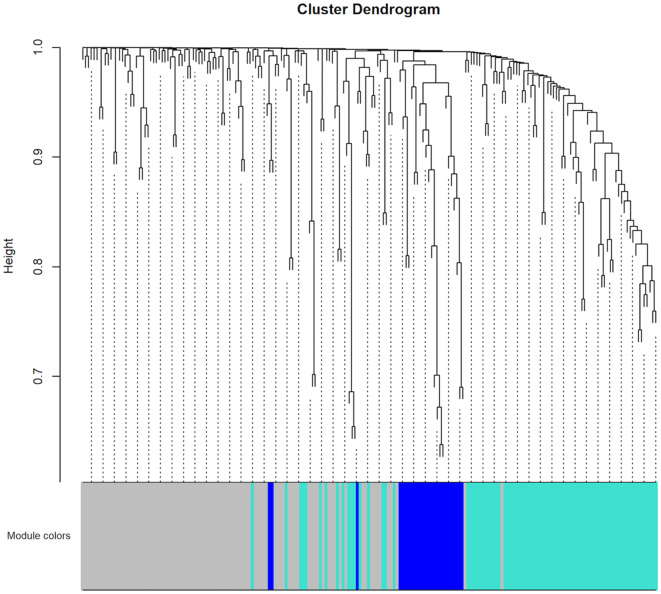
Figure 2.
Hierarchical clustering results of co-expression modules in the patients with DLBCL (n=48). WGCNA was applied to perform the hierarchical clustering. These co-expression modules are demonstrated in different colors with 83 and 26 genes in the turquoise and blue modules, respectively. The grey color represents no genes in any modules.

