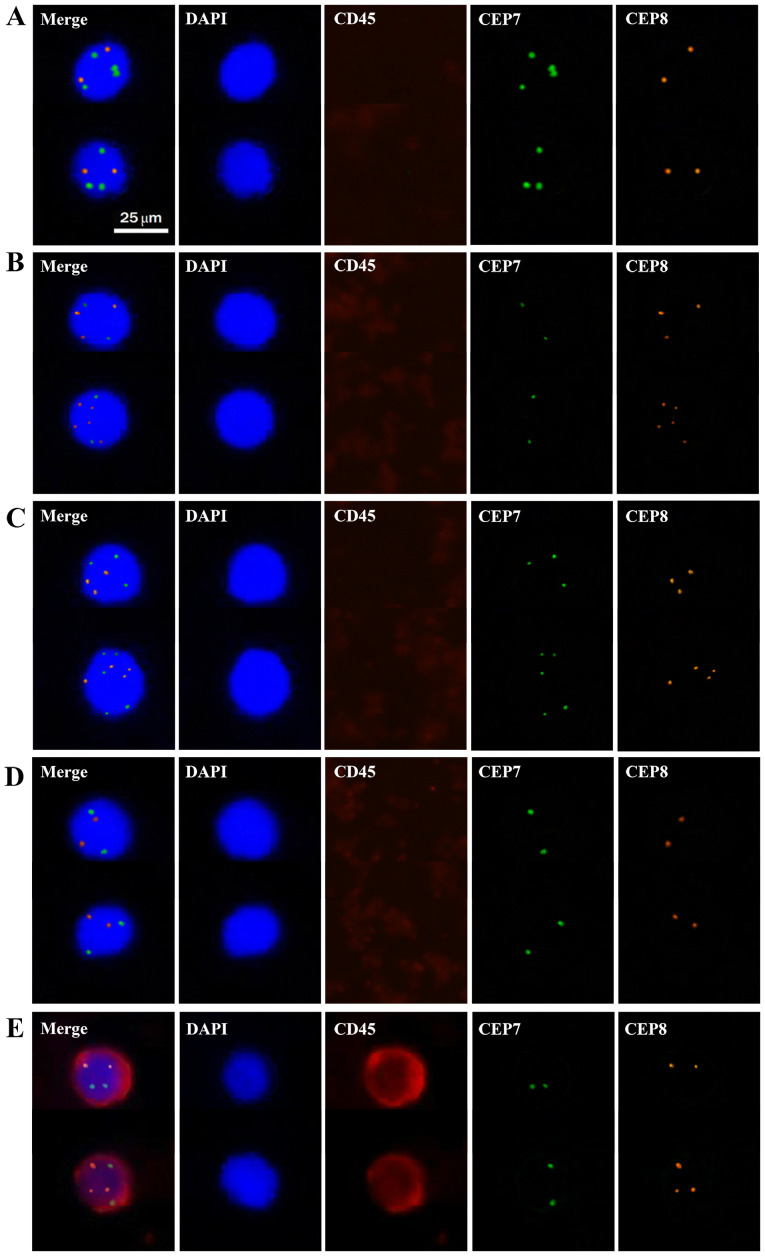
Figure 1.
Representative images of cells detected in the peripheral blood of patients with colorectal cancer. Cell nuclei stained with DAPI appear blue. Cytokines stained with CD45 antibody appear red. Chromosomes stained with CEP7 appear green. Chromosomes stained with CEP8 appear orange. (A) CD45-, DAPI+ and CEP7>2/CEP8=2; (B) CD45-, DAPI+ and CEP7=2/CEP8>2; (C) CD45-, DAPI+ and CEP7>2/CEP8>2; (D) CD45-, DAPI+ and CEP7=2/CEP8=2; (E) CD45+, DAPI+ and CEP7≥2/CEP8≥2. Cells in groups A-C were defined as CTCs, whereas cells in groups D and E were defined as normal leukocytes. Magnification, ×400. CTC, circulating tumour cell; CEP7, chromosome 7; CEP8, chromosome 8.

