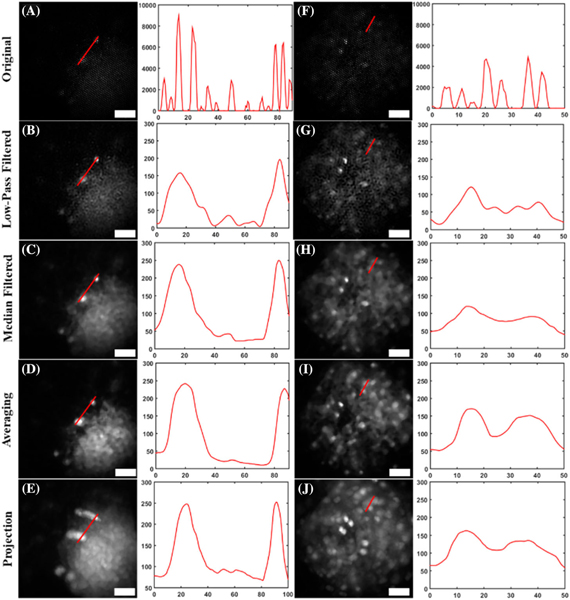
Fig. 6.
Reconstructed images of brain slices from transgenic mice expressing GFP, and corresponding line plots for each image. Two separate brain slices [(A)–(E) and (F)–(J)] are shown after (B), (G) low-pass filtering; (C), (H) median filtering; (D), (I) averaging with the proposed reconstruction technique; and (E), (J) using the maximum projection method in the proposed technique. Notice how in the sparser neural samples, imperfections in image registration lead to poorer image reconstruction (E), (J), compared to the less sparse resolution targets. The vertical axes of the profile plots have gray-scale value units, and the horizontal axes represent distance, in micrometers. Scale bars in images represent 50 μm.

