Fig. 4.

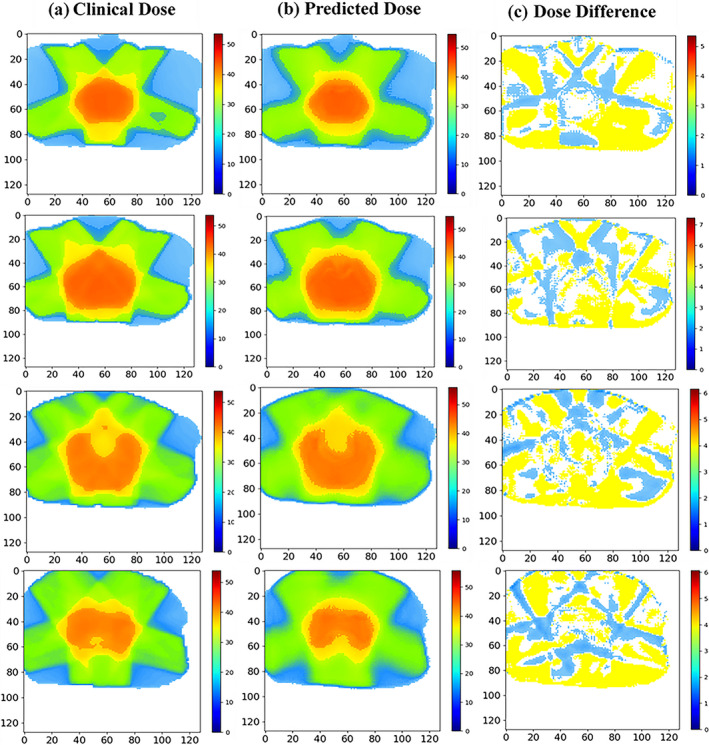
(a) clinical dose distribution, (b) predicted dose distribution, and (c) dose difference map in four trans‐axial slices of a postoperative rectal cancer case. The unit of color bar is Gy.

(a) clinical dose distribution, (b) predicted dose distribution, and (c) dose difference map in four trans‐axial slices of a postoperative rectal cancer case. The unit of color bar is Gy.