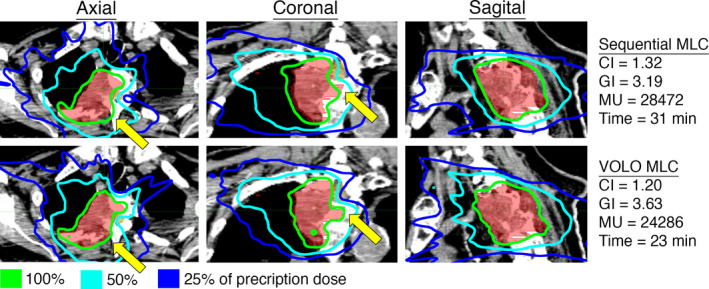
Fig. 4.

Representative case in the Spine Complex (SC) category. Axial, coronal, and sagittal view of the dose distribution for an example case planned with the Sequential and VOLO optimizer utilizing MLC collimation. The CI, GI, number of MUs, and treatment time are shown for the two plans. The yellow arrows represent significant differences between the plans.
