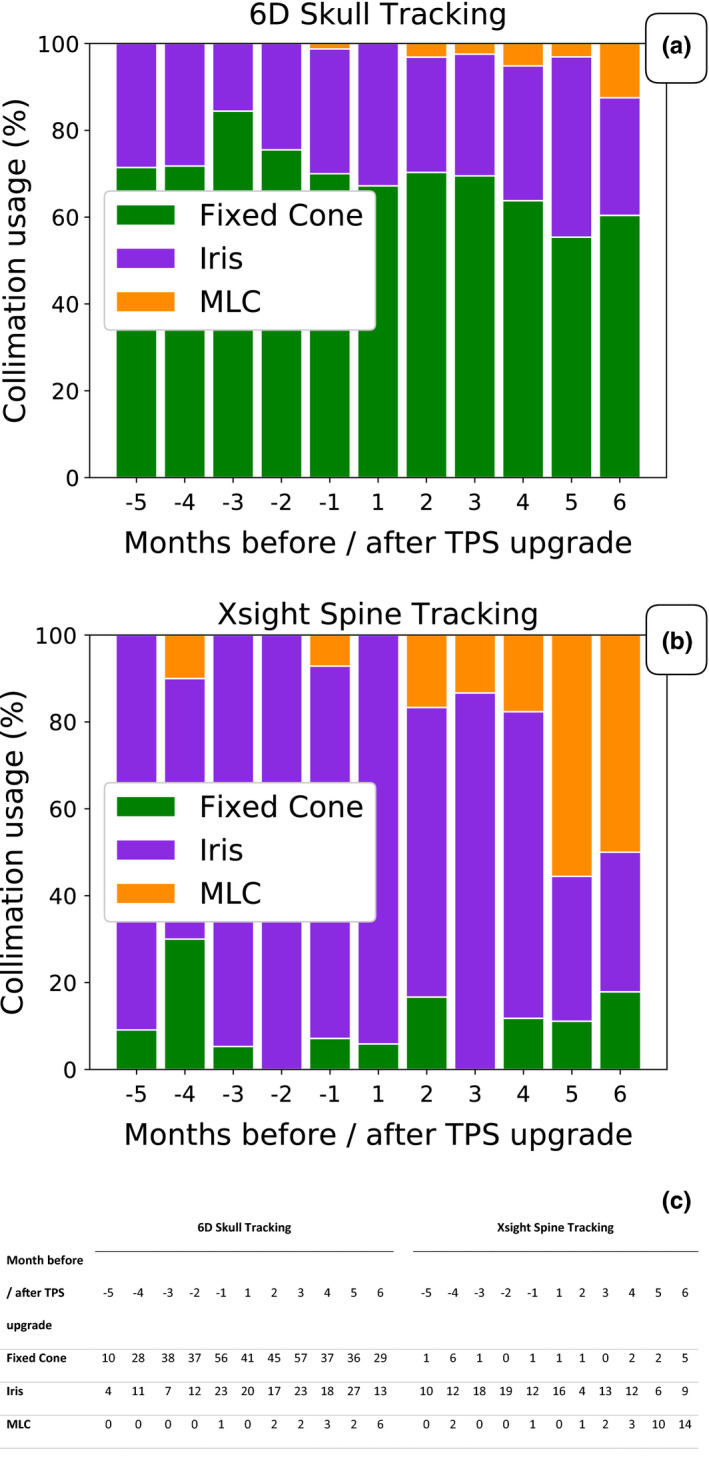
Fig. 7.

Population analysis: Collimator usage. Collimation usage distribution from 5 months before to 6 months after TPS upgrade. a) and b) show the distribution between fixed cone, Iris, and MLC collimation usage for treatment plans utilizing 6D Skull and Xsight Spine tracking, respectively. The absolute numbers are shown in c) with the introduction of the VOLO optimizer an increase in MLC collimation usage was seen. For plans generated with Xsight Spine tracking, the MLC usage was higher than Iris usage at five and six months after the TPS upgrade.
