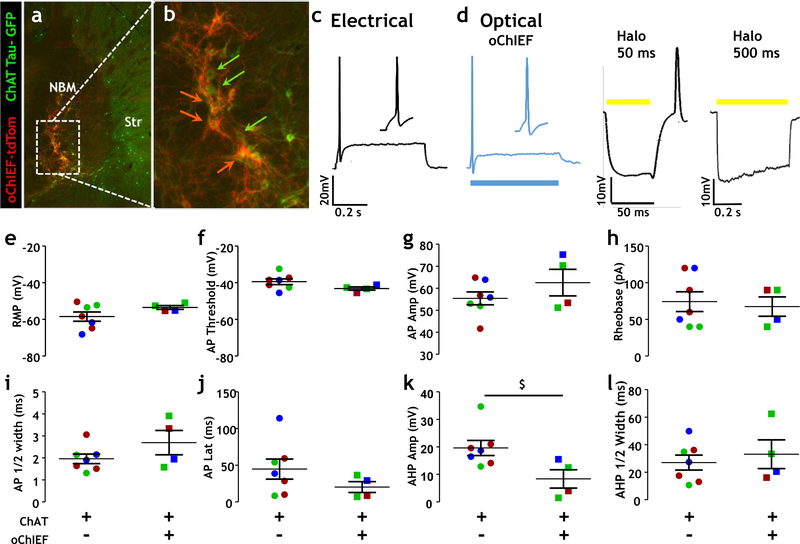
Fig 3. Comparison of electrical properties of opsin negative and opsin labeled cholinergic neurons in the NBM.
a Fluorescence photomicrograph of cholinergic (ChAT tau-GFP positive) neurons in the NBM region of the basal forebrain overlapping with tdTomato tagged cholinergic neurons expressing a viral vector encoding a ChR2 variant, oChIEF.
b Enlarged view of fluorescence photomicrograph from panel a. Green arrows label cholinergic neurons (ChAT tau-GFP labeled) and orange arrows represent ChAT tau-GFP and oChIEF labeled (overlap between ChAT tau-GFP neurons labeled with opsin, orange cell bodies/processes).
c,d Sample recording depicting AP firing in cholinergic neurons (and inset showing AP waveform) using both (c) electrical stimulation and (d) optical stimulation, following depolarization for 500 ms. Activation of halorhodopsin on NBM cholinergic neurons by 50 ms of yellow light stimulation (d middle panel) results in hyperpolarization during light stimulation and produces an off-response AP following termination of light. Activation by 500 ms of yellow light stimulation (d right panel) results in persistent hyperpolarization with decay, with no off-response AP observed.
e-h Scatter plots showing resting membrane potential (e), AP threshold (f), AP amplitude (g) and rheobase (h) of ChAT tau-GFP/oChIEF negative neurons and ChAT tau-GFP/oChIEF positive neurons. There was no significant difference in these measures between groups.
i-l Scatter plots showing all AP ½-width (i), AP latency (j), AHP amplitude (k) and AHP ½-width (l) values for ChAT tau-GFP/oChIEF negative neurons and ChAT tau-GFP/oChIEF positive neurons. There was no significant difference in AP ½-width or latency or AHP ½-width between groups. There was a trend towards a reduced AHP amplitude (k) in the ChAT tau-GFP/oChIEF positive neurons compared to the ChAT tau-GFP/oChIEF negative neurons ($; Mann Whitney test, p = 0.024, power = 0.44)
Action potential properties were evaluated at rheobase current injection. Data from ChAT tau-GFP/oChIEF negative neurons (n = 7 neurons, 3 mice) are displayed on the left side of graphs, and ChAT tau-GFP/oChIEF labeled (n = 4 neurons, 3 mice) are displayed on the right side of graphs. Colors indicate data points obtained from the same mouse.

