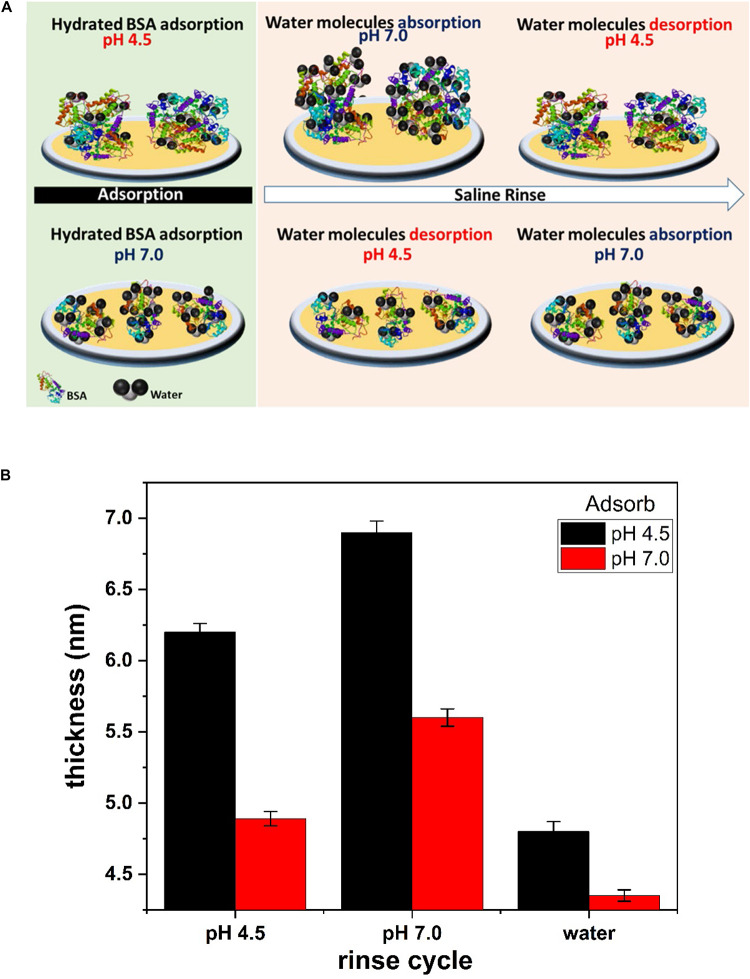
FIGURE 6.
(A) Schematic representation of BSA sorption and conformation on the liquid/gold interface at pH 4.5 and 7.0. Saline rinse of BSA layer adsorb/desorb water molecules at pH 7.0/4.5. (B) Thickness of the BSA layer evaluated from the Sauerbrey model. The hydrated BSA layer adsorbed at pH 4.5 and pH 7.0 is plotted at different saline and water rinse cycle.

