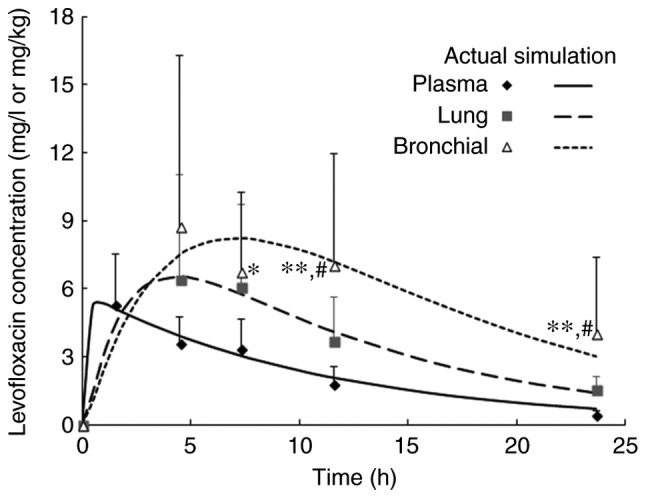
Figure 2.

Time profiles of levofloxacin in plasma (µg/ml) or tissue samples (µg/g) after single oral administration of a 500-mg tablet in patients undergoing pulmonary operation. Values are expressed as the mean ± standard deviation (n=32 at 1.5 h or 8 at the other time-points) and predictions were made by a pharmacokinetic model. *P<0.05, **P<0.01 compared to plasma (least-significant difference test); #P<0.05 compared to lung tissue (least-significant difference test).
