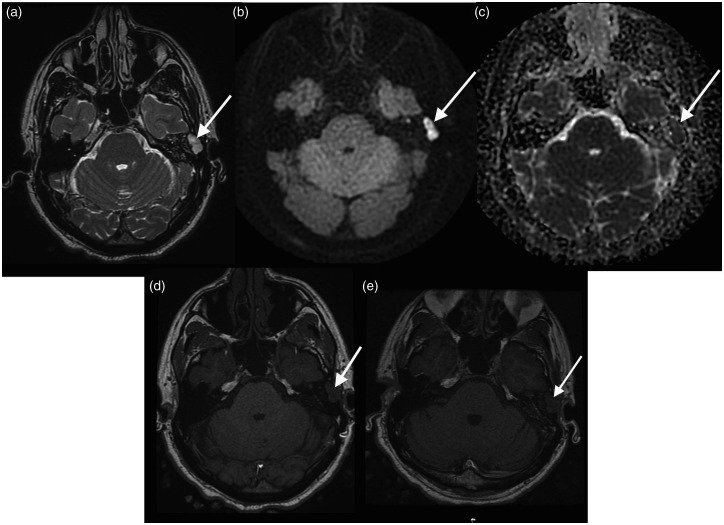
Figure 1.
Cholesteatoma recurrence. (a) T2 weighted image demonstrating abnormal high T2 signal in the region of the left mastoid cavity (arrow); (b) PROPELLER DWI showing high signal in the corresponding region; (c) apparent diffusion coefficient (ADC) map showing corresponding low signal; (d) T1 pre-contrast showing no intrinsic T1 hyperintensity; and (e) T1 delayed post-contrast image showing no enhancement in this lesion consistent with cholesteatoma recurrence.

