Fig. 4.
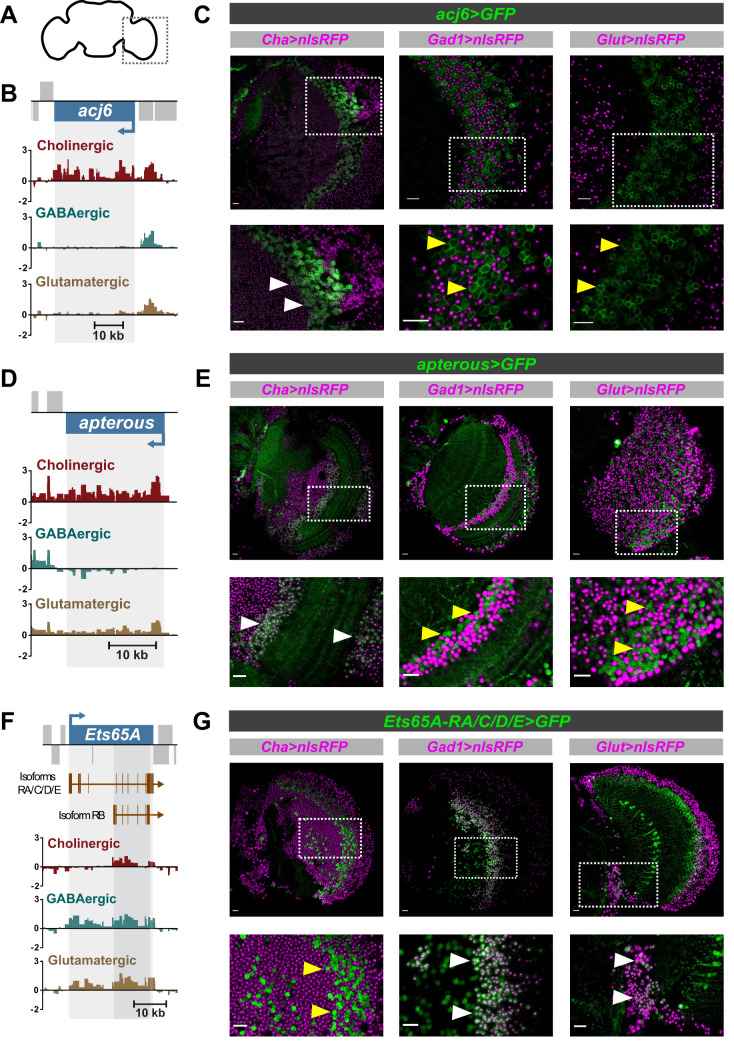
Expression of acj6, apterous and Ets65A-RA/C/D/E in the adult brain. (A) Schematic of adult brain to show region of interest. (B) Pol II occupancy at acj6 in the adult brain. Y-axis represent log2 ratios of Dam-Pol II over Dam-only. FDR values are shown for significant differences (<0.01). (C) Expression pattern of acj6. White arrows show examples of colocalisation and yellow arrows absence of colocalisation. (D) Pol II occupancy at apterous. (E) Expression pattern of apterous in the adult brain. (F) Pol II occupancy at Ets65A in the adult brain. (G) Expression pattern of Ets65A-RA/C/D/E.

