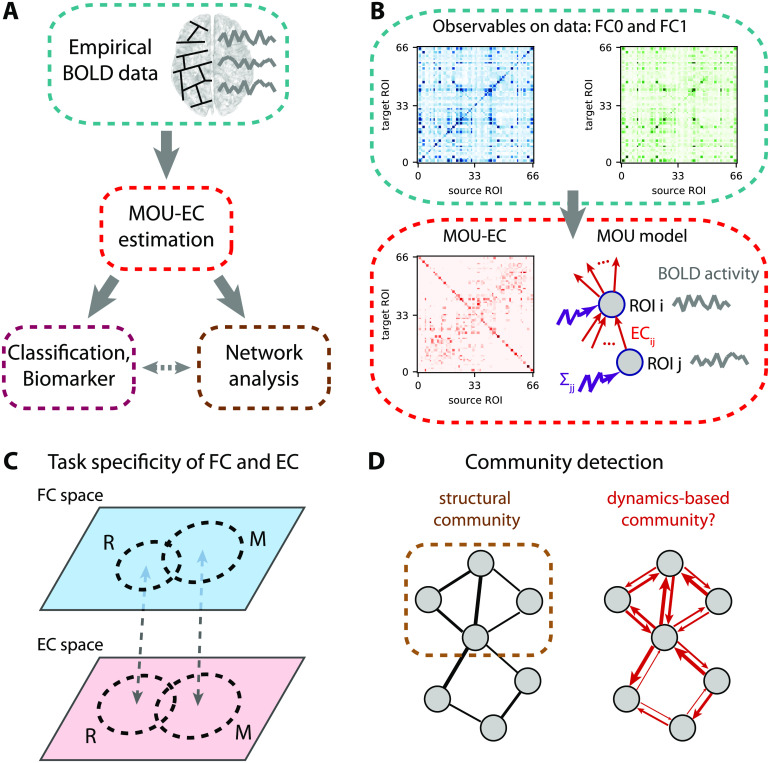
Figure 2. .
EC-based analysis of empirical BOLD signals. (A) Pipeline for brain coordination analysis using MOU-EC. For each fMRI session, the model is optimized by tuning its parameters, especially its connectivity, to reproduce the statistics of the BOLD signals (depicted in the right side of the brain). A schematic parcellation is represented on the left hemisphere of brain. The estimated MOU-EC can then be used to predict cognitive states using classification algorithms. On the other hand, MOU-EC can be analyzed as a graph (or network) to uncover collective properties. A contribution of our approach is to link the network-oriented analysis with machine-learning techniques. (B) From the BOLD signals, two FC matrices are calculated, FC0 without time lag in blue and FC1 with a time lag of 1 TR in green. The model parameters (MOU-EC and Σ) are optimized to reproduce these empirical FC matrices. Classification focuses on the model connectivity (e.g., MOU-EC), but the influence of Σ will be incorporated in the network analysis. See Figure S1 for further details. (C) Schematic representation of the FC and MOU-EC matrices (one sample per session) in their own spaces for two cognitive states (R for rest and M for movie). For each connectivity measure, the prediction of R versus M is robust when the sample distributions represented by the dashed circles do not overlap. (D) The left diagram represents community detection in a structural undirected network. The right diagram represents the MOU-EC networks, from which we want to define dynamics-based communities.

