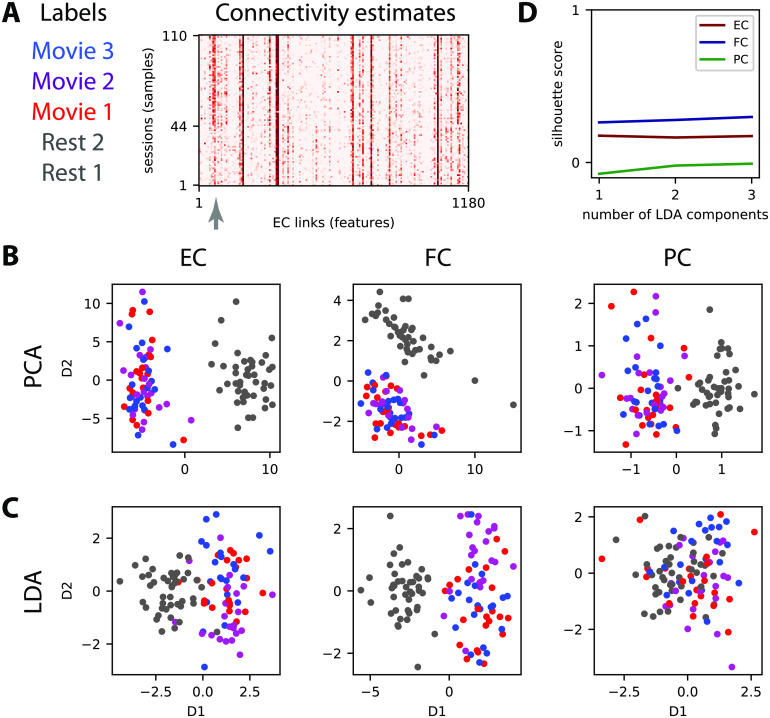
Figure 3. .
Dimensionality reduction of the connectivity measures. (A) Connectivity estimates (here vectorized EC) for five sessions, two for rest and three for movie, for each of the 22 subjects. Each of the three movie sessions corresponds the three movie sessions each of corresponds to a distinct part (10 min) of a movie watched and listened to by the subjects. The gray arrow indicates connections (or links) that strongly differ between rest and movie. (B) Principal component analysis (PCA) applied to the vectorized EC, FC, and PC (one for each of the 110 sessions) where the same colors as in panel A correspond to the 4 tasks. For PCA the task labels are not used in the dimensionality reduction (unsupervised algorithm). (C) Similar plot to panel B with linear discriminant analysis (LDA) for which the labels are used (supervised learning) to separate the four tasks for the 110 sessions. (D) The silhouette coefficient measures the quality of the clustering for the four dot clouds when varying the number of LDA components (see x-axis).

