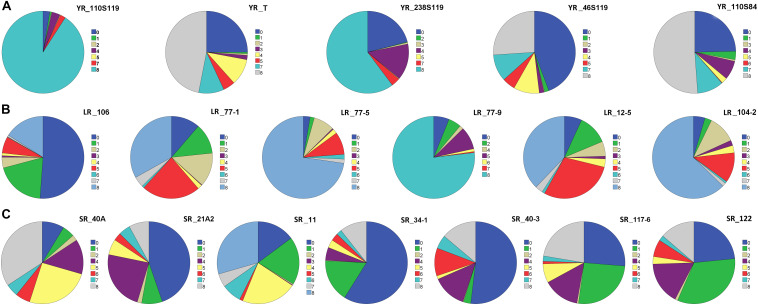
FIGURE 1.
Pie chart representation of seedling response against (A) five pathotypes of stripe rust (YR), (B) six pathotypes of leaf rust (LR), and (C) seven pathotypes of stem rust (SR) of rust association mapping panel (RAMP). The color legend on the right side of each pie chart represents the infection type (IT) score. The magnitude of arc length is directly proportional to the frequency of genotypes showing corresponding IT scores.

