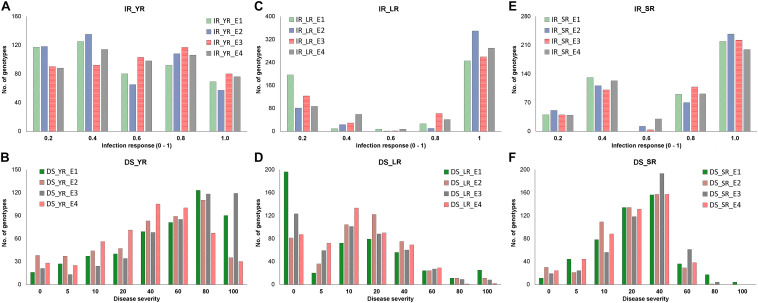
FIGURE 2.
Distribution of adult plant stage disease response as infection response (IR) and disease severity (DS) in corresponding four environments (E1-E4) in the panel. Frequency of genotypes having IR (y-axis) for YR (A), LR (C), and SR (E) was recorded on the scale of 0-1 (x-axis), whereas the frequency of genotypes having DS (y-axis) for YR (B), LR (D), and SR (F) was recorded on the scale of 0-100 (x-axis). Each environment is represented with different colors as indicated by the color legend.

