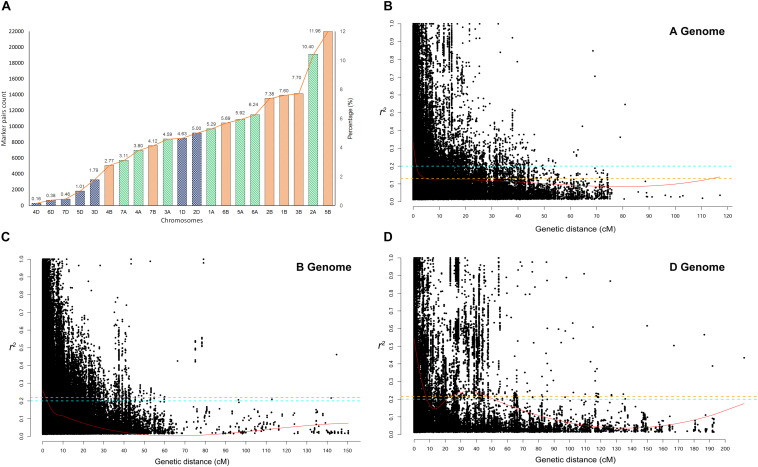
FIGURE 4.
(A) Chromosome wise significant marker pairs that showed Linkage disequilibrium (LD) due to genetic linkage. LD decay plot is shown as a scatter plot of pairwise SNP LD r2− value over the genetic distance between each intra-chromosomal marker pairs for (B) A genome, (C) B genome, and (D) D genome. LOESS smoothening curve (red curved line) was fitted to the LD decay. Orange dash line represents the 95th percentile unlinked r2 line for (A) (r2 = 0.126), (B) (r2 = 0.219), and (D) (r2 = 0.215) genomes. The Cyan dash line represents the critical r2 (=0.201) of the whole genome.

