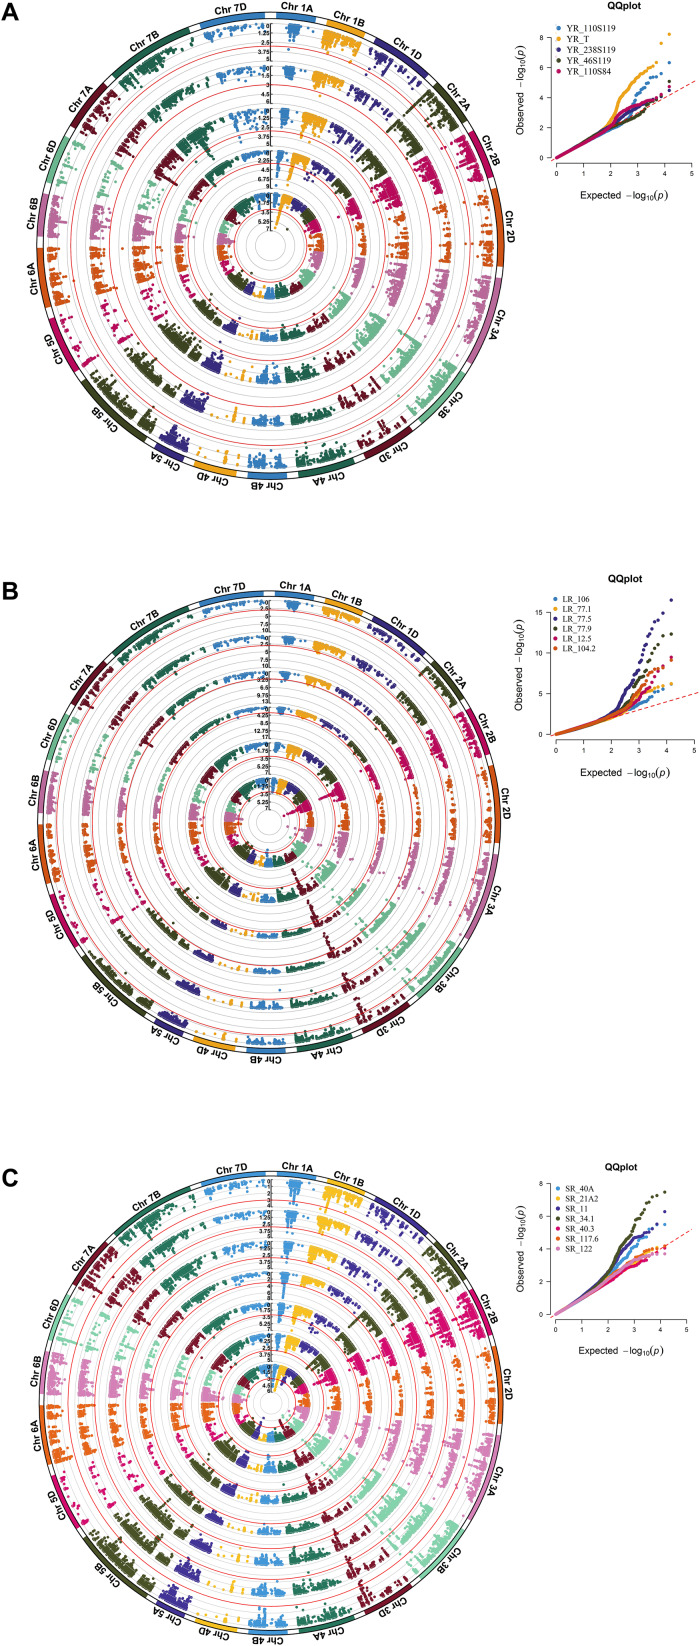
FIGURE 5.
A circular Manhattan plot for significance [–log10(p-values)] of the association of 14,650 SNPs based on CMLM located on 21 chromosomes with the seedling disease responses against pathotypes of the three rusts. Associations for the (A) five YR pathotypes YR_110S119, YR_T, YR_238S119, YR_46S119, and YR_110S84; (B) six LR pathotypes LR_106, LR_77-1, LR_77-5, LR_77-9, LR_12-5, and LR_104-2; and (C) seven SR pathotypes SR_40A, SR_21A2, SR_11, SR_34-1, SR_40-3, SR_117-6, and SR_122 were plotted from inside to outside, respectively. A multi-track Q-Q plot for each case is presented at the right upper corner of the circular Manhattan plot. The threshold value at –log10(p) ≥ 3 is indicated as red-colored circle for each pathotype. A rectangular version of the plots is shown in Supplementary Figure S4.

