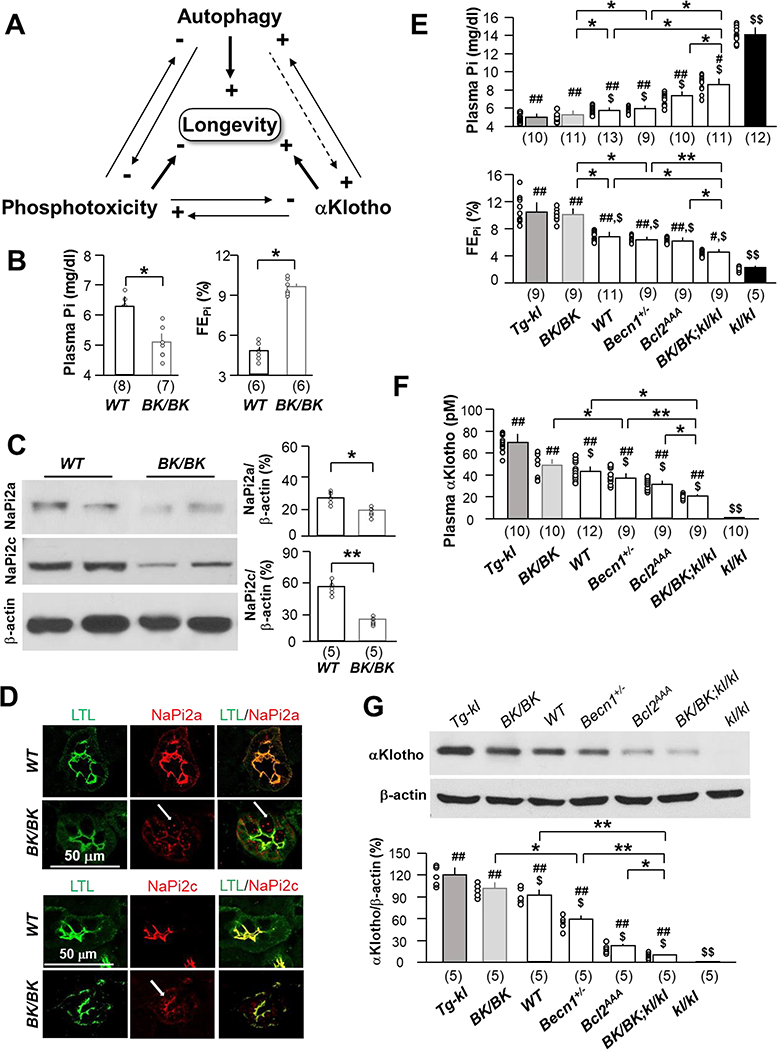
Fig. 1. High autophagic flux-induced improvement of phosphate homeostasis is associated with increased urinary phosphate excretion and αKlotho in the kidney and the circulation.
(A) Proposed model for interplay of Pi, autophagy, and αKlotho in health maintenance and prolongation of murine lifespan. Both autophagy and αKlotho suppress phosphotoxicity. High Pi inhibits both autophagy and αKlotho function. αKlotho also directly upregulates autophagy through reduction of the beclin 1/BCL2 complex, and autophagy upregulates αKlotho partly through reducing plasma Pi. Potentially high autophagy can directly stimulate αKlotho (dash line). Overall autophagy and αKlotho promote and high Pi reduces longevity. (B) Plasma Pi (left panel) and fractional excretion of phosphate (FEPi) (right panel) of WT and BK/BK mice at 12 weeks-old without intervention. The data are presented at mean ± S.D. plus scatter plots of individual data points. (C) Immunoblots for NaPi-2a and −2c protein in the kidney of WT and BK/BK mice at 12 weeks-old. Left panel shows representative immunoblots. Right panel is quantitation of all blots from 5 mice in each group. Data are presented as mean ± S.D. *P<0.05, **P<0.01 between two groups by unpaired t-test for B - C. (D) Representative immunohistochemistry for NaPi-2a (upper two panel) and NaPi-2c (bottom two panel) in the kidney of WT and BK/BK mice at 12 weeks-old. Each genotype has 4 mice. Scale bar = 50 μm. Arrows indicate endocytosed NaPi-2a/2c. (E) Plasma phosphate (Pi) (upper panel) and fractional excretion of phosphate (FEPi) (bottom panel) and (F) plasma renal αKlotho in mice with different levels of αKlotho (Tg-kl, WT, and kl/kl) and different levels of autophagy flux (BK/BK, Becn1+/−, Bcl2AAA, WT and BK/BK;kl/kl) at 10 weeks-old. (G) renal αKlotho protein expression in mice with different levels of αKlotho (Tg-kl, WT, and kl/kl) and different levels of autophagy flux (BK/BK, Becn1+/−, Bcl2AAA, WT and BK/BK;kl/kl) at 10 weeks-old. Upper panel is representative blot for αKlotho protein; bottom panel is quantitation of all blots from 5 mice in each group. Data shown in B, C, and E - G are mean ± S.D. plus scatter plots of individual data points. *P<0.05, **P<0.01 between two groups; $P<0.05, $ $P<0.01 vs Tg-kl mice; #P<0.05, ##P<0.01 vs kl/kl mice by one-way ANOVA followed by Student-Newman-Keuls post hoc test. The sample size of each genotype is shown in parentheses for B, C, and E - G.

