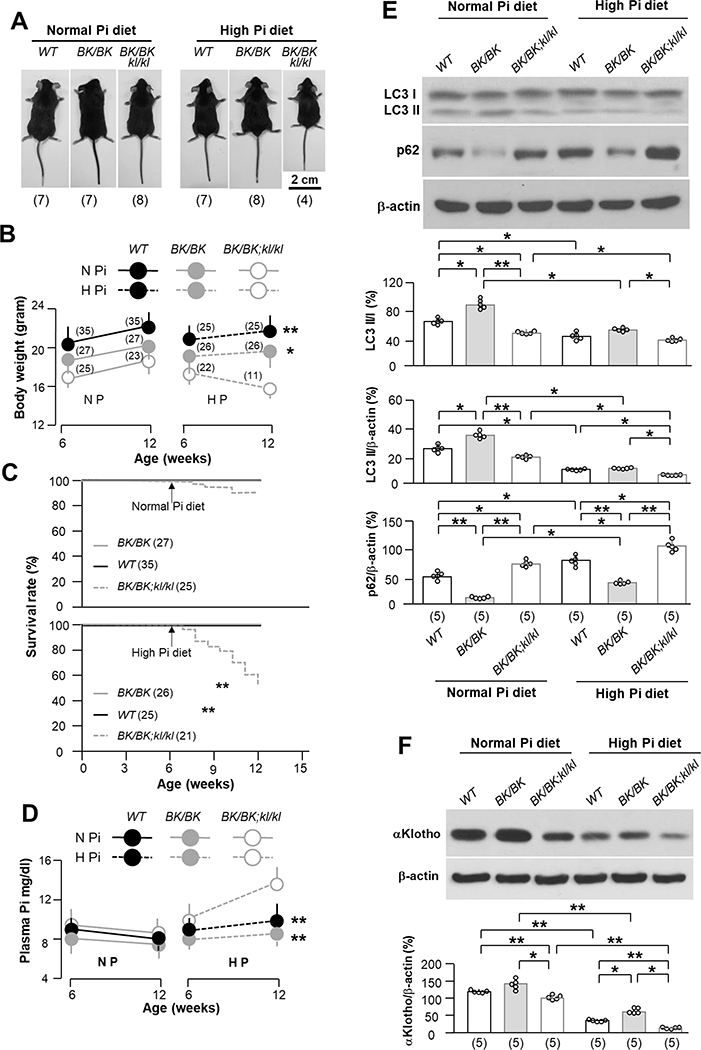
Fig. 5. High dietary Pi abolishes beneficial effect of becn1F121A on prolonging life, growing, Pi metabolism and αKlotho upregulation in kl/kl mice.
(A) Comparison of mouse body size among 3 genotypes (WT, BK/BK, and BK/BK;kl/kl) treated normal (0.7%) or high (2.0%) Pi diet at 12 weeks old after 6-week treatment starting at 6 weeks old. Representative photos of male mouse bodies randomly selected from three genotypes. The animal number per treatment is shown in parenthesis at the bottom of photos. (B) Body weights of male and female mice of three genotypes at the beginning and the end of 6-week normal or high Pi treatment. The mouse number is shown in parenthesis. Data are presented as means ± S.D. *P<0.05; **P<0.01 vs BK/BK;kl/kl mice after 6-week normal or high Pi diet by one-way ANOVA followed by Student-Newman-Keuls post hoc test. (C) Kaplan-Meier survival rate of three genotypes from 6 to 12 weeks during 6-weeks of normal or high dietary Pi. The animal number in each group is shown in parenthesis. ** P<0.01 BK/BK;kl/kl mice was determined by log-rank (Mantel-Cox) test. (D) Plasma Pi in 3 genotypes before and after normal or high Pi dietary treatment. Data are presented as means ± S.D. The animal number of each group is same as shown in Figure 5B. **P<0.01 vs WT mice after 6-week normal or high Pi diet by one-way ANOVA followed by Student-Newman-Keuls post hoc test at indicated time point. (E) Immunoblots of total kidney lysates for autophagic markers in the kidney of 3 genotypes treated with normal or high Pi diet. Upper panel shows representative blots from each treatment. Bottom panel is summary of data presented as mean ± S.D. with scatter plots of individual data points. Each group has 5 mice. (F) Immunoblots of total kidney lysates for αKlotho expression. Upper panel is representative blots from 5 mice for each treatment. Bottom panel is summarized data from all of blots presented as mean ± S.D. with scatter plots of individual data points. *P<0.05, **P<0.01 between two groups by two-way ANOVA followed by Student-Newman-Keuls post hoc test for E and F.

