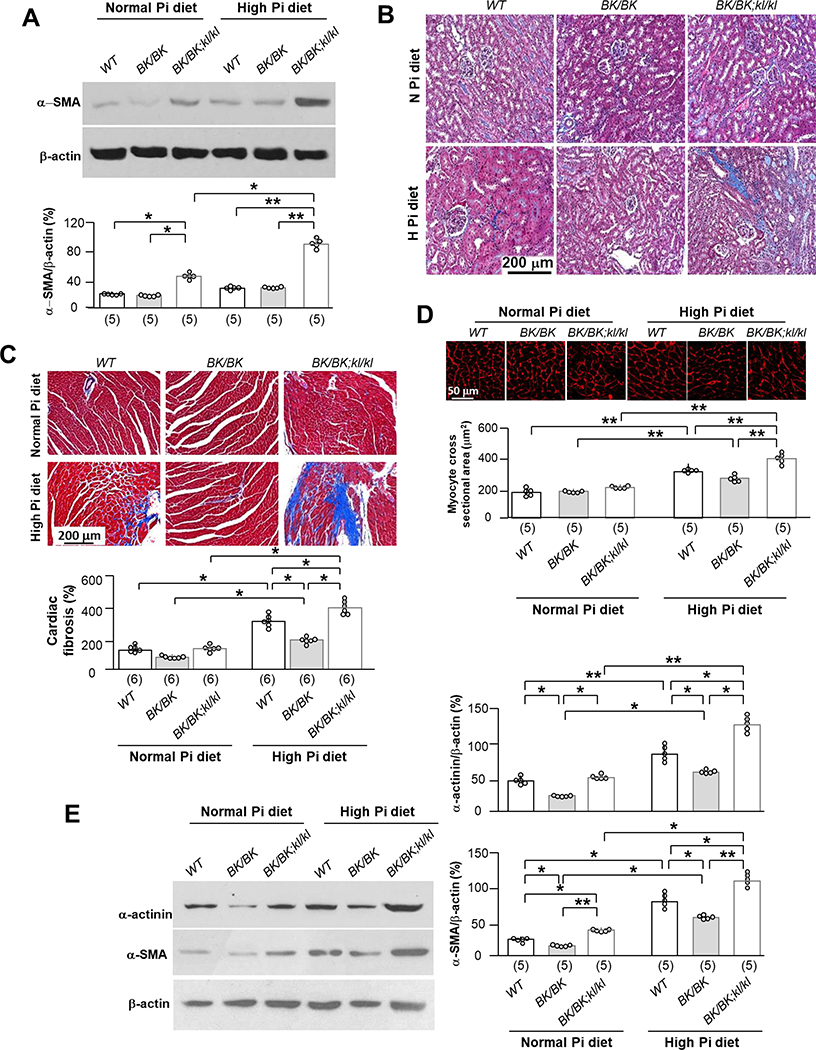
Fig. 6. High dietary Pi blocks beneficial renal and cardiac effect of becn1FA on kl/kl mice.
Mice of three genotypes (WT, BK/BK, and BK/BK;kl/kl) were treated with normal or high Pi diet for 6 weeks starting at 6 weeks old as mentioned in Figure 4. (A) Immunoblots of total kidney lysates for α-SMA expression. Upper panel is representative blots from each treatment. Bottom panel is summarized data presented as mean ± S.D. with scatter plots of individual data points. Each treatment has 5 mice. (B) Trichrome stain in the kidney sections of 3 genotypes after 6-week dietary Pi treatment. Representative microscopic images of Trichrome stain in kidney sections from each treatment. Scale bar = 200 μm. Each treatment has 5 mice. (C) Representative microscopic images of Trichrome stained heart sections. Each genotype has 6 mice. Scale bar = 200 μm. Bottom panel summarizes cardiac fibrosis scores from trichrome-stained heart sections presented as mean ± S.D. with scatter plots of individual data points. (D) Wheat germ agglutinin (WGA) stain in left ventricle sections of 3 genotypes after 6-week Pi treatment. Upper panel is representative microscopic images of WGA stain from each treatment. Scale bar = 50 μm. Bottom panel is summary of data presented as mean ± S.D. with scatter plots of individual data points. Each treatment has 5 mice. (E) Immunoblots of total left ventricle lysates for α-actinin and α-SMA expression. Left panel is representative blots from each treatment. Right panel is summary data presented as mean ± S.D. with scatter plots of individual data points. Each treatment has 5 mice. *P<0.05, **P<0.01 between two groups by two-way ANOVA followed by Student-Newman-Keuls post hoc test for A, C - E.

