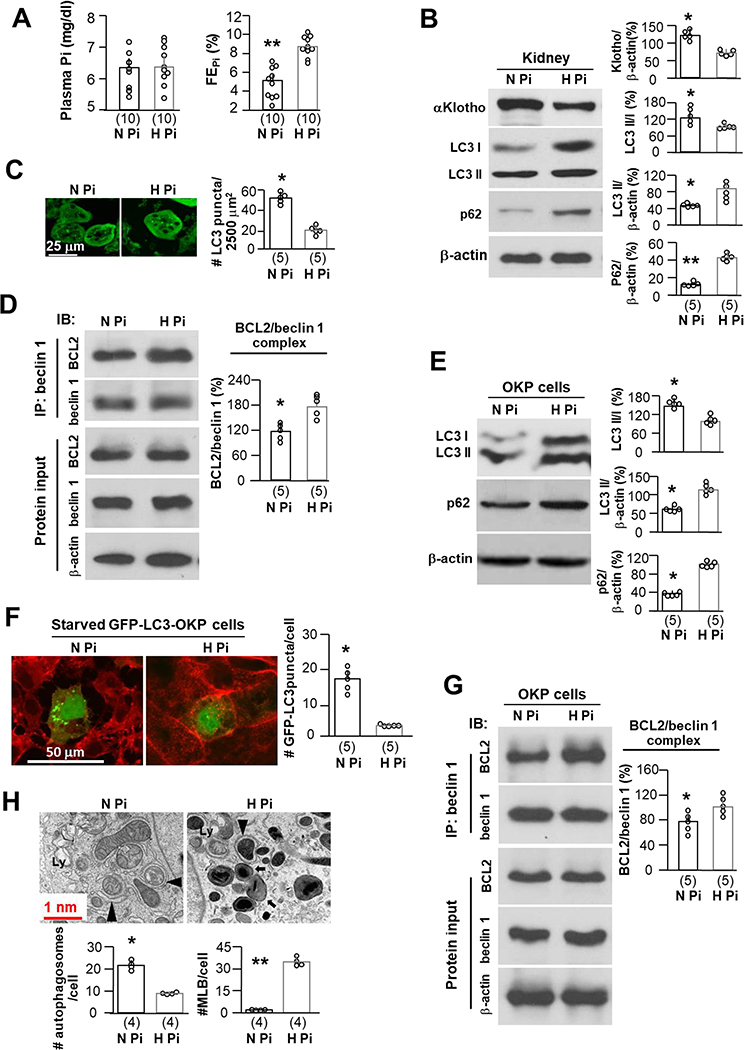
Fig. 7. High Pi decreases autophagy flux and downregulates αKlotho.
WT mice were fed with normal or high Pi diet starting at 10 weeks old for 2 weeks. (A) Plasma Pi (left panel) and fractional excretion of phosphate (FEPi) (right panel) after 2-week dietary Pi treatment. The data are presented as mean ± S.D. plus scatter plots. Each treatment has 10 mice. (B) Immunoblots of total kidney lysates for αKlotho, LC3 and p62 protein in the kidneys of mice from A. Left panel is representative immunoblots from each treatment. Right panel is summary of data from all of blots and presented as mean ± S.D. with scatter plots of individual data points. Each treatment has 5 mice. (C) Autophagic flux in the kidneys of GFP-LC3 reporter mice treated normal or high Pi diet for 2 weeks starting at 10 weeks old. Each treatment has 5 mice. Four hours prior to sacrifice, mice were treated intraperitoneally with chloroquine treatment. Left panel is representative images of GFP-LC3 immunofluorescence in the renal tubules. Scale bars = 25 μm. Right panel summarizes quantitation of GFP-LC3 punctas in renal tubules. The data are presented as mean ± S.D. with scatter plots of individual data points. Each treatment has 5 mice. (D) Co-immunoprecipitation of beclin 1 and BCL2 in total kidney lysates from 5 mice presented in Figure 6B. Left upper panel shows representative immunoblots for Co-IP. Left bottom panel shows representative immunoblots from protein inputs. Right panel is a summary of co-IP data from 5 independent experiments. Data are presented as mean ± S.D. with scatter plots of individual data points. (E) OKP cells were treated normal Pi (0.96 mM) or high Pi (3.0 mM) media. At 24 hours, cells were harvested. Autophagic flux in OKP cells treated with normal or high Pi media is evaluated. Left panel shows representative immunoblots of total cell lysates for LC3 and p62 protein from 5 independent experiments. Right panel summarizes the data presented as mean ± S.D. with scatter plots of individual data points. (F) OKP cells were transiently transfected with GFP-LC3 plasmid and 48 hours later were treated with normal Pi or high Pi media for 24 hours. Left panel shows representative images of GFP-LC3 immunofluorescence from 5 independent experiments. Right panel is the summary of quantitative data of LC3 punctas presented as mean ± S.D. with scatter plots of individual data points. Scale bars = 50 μm. (G) Co-immunoprecipitation of beclin 1 and BCL2 in total cell lysates from Figure 6E. Left upper panel shows representative immunoblots for Co-IP. Left bottom panel shows representative immunoblots from protein inputs. Right panel is a summary of co-IP data from 5 independent experiments. Data are presented as mean ± S.D. with scatter plots of individual data points. (H) Autophagic ultramicroscopic structures in OKP cells treated with normal or high Pi media descripted in Figure 6E. Upper panel is representative electronic microscopic images showing autophagosomes (arrow head) and autolysosomes (Ly) and multilamellar bodies (MLB) (arrow). Scale bars = 1.0 nm. Bottom panels are summaries of autophagosomes and MLB per cell from total 25 cells of normal (N Pi) or high Pi (H Pi) treatment from 4 independent experiments. The data were presented as mean ± S.D. with scatter plots of individual data points. *P<0.05; **P<0.01 between 2 groups by unpaired t-test for A-C, E, F, and H.

