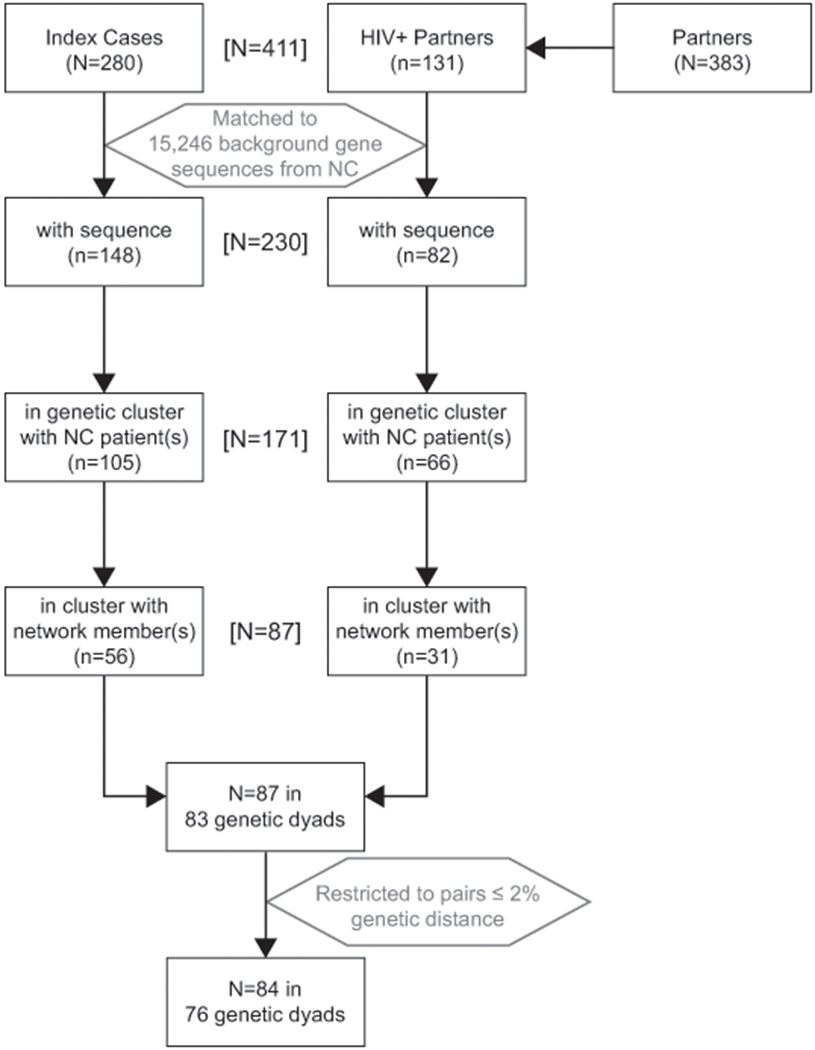
Figure 1.

Flow chart of inclusion into the analysis dataset (N=84 people in 76 genetic dyads), starting from the parent study Wake County sociosexual network (N=663, 62% HIV-positive (n=411)). We further analyzed genetic clusters which included at least 2 persons from the partner notification network.
