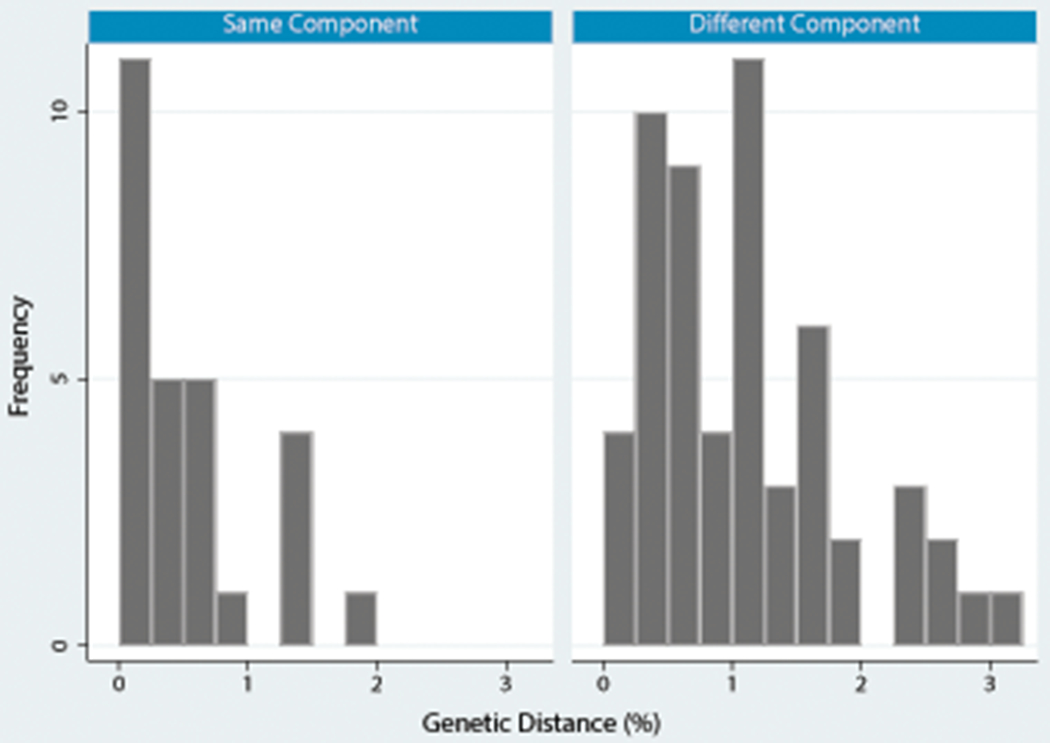
Figure 3.

HIV genetic distance by outcome (pairwise network component location) among pairs of members of the same genetic cluster. Clusters were defined as ≤ 3.5% pairwise genetic distance across all possible pairs of cluster members (N=83 pairs), but this analysis was restricted to the analysis set of pairs ≤ 2.0% pairwise genetic distance (N=76 pairs). All 83 possible pairs among cluster members (≤ 3.5%) are included in this graph so that the full distribution of genetic distance can be seen.
