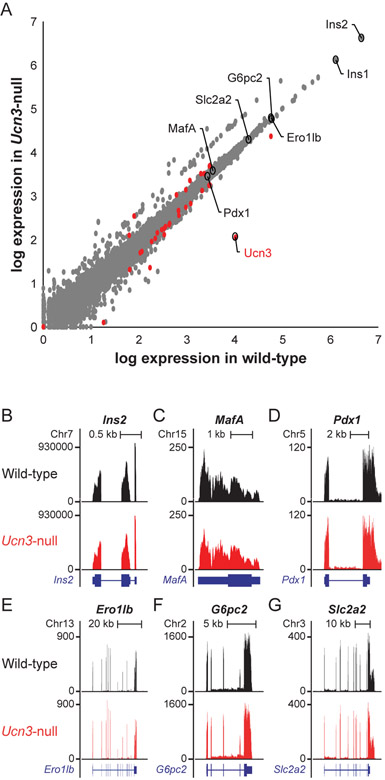
Figure 1. Genes encoding beta cell maturity markers are not differentially regulated between Ucn3-null mice and wild-type littermates.
(A) Volcano plot showing global gene expression in wild-type vs Ucn3-null mice. Differentially expressed genes are denoted as red circles. Select markers of beta cell maturity are circled and labeled. Ucn3 is depleted in Ucn3-null mice, confirming knockout, while other beta cell maturity markers are not affected at the transcript level. (B-G) Visualization of relative reads of different transcripts in Ucn3-null mice (red) compared to wild-type (black). (B) Ins2, (C) MafA, (D) Pdx1, (E) Ero1lb, (F) G6pc2, (G) Slc2a2.

