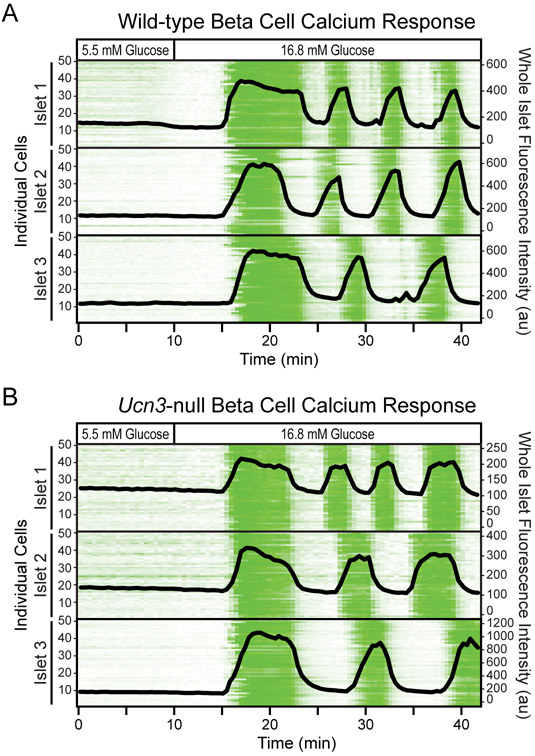
Figure 5. Beta cell calcium response remains unaltered in mice that do not express UCN3.
Calcium responses of several intact islets were obtained simultaneously over time. All islets expressed the calcium sensor GCaMP6s selectively in beta cells (MIP-Cre/ERT x lsl-GCaMP6s) with or without Ucn3-null in the background. The trace began with low glucose and was switched to high glucose at the indicated timepoint. The calcium traces of beta cells within 3 representative islets from (A) wild-type mice and (B) Ucn3-null mice are shown as intensity plots. Each line represents the activity of an individual beta cell over time, and green represents an increase in fluorescence intensity. A line graph of the fluorescence intensity at the whole islet level is overlaid over each intensity plot.

