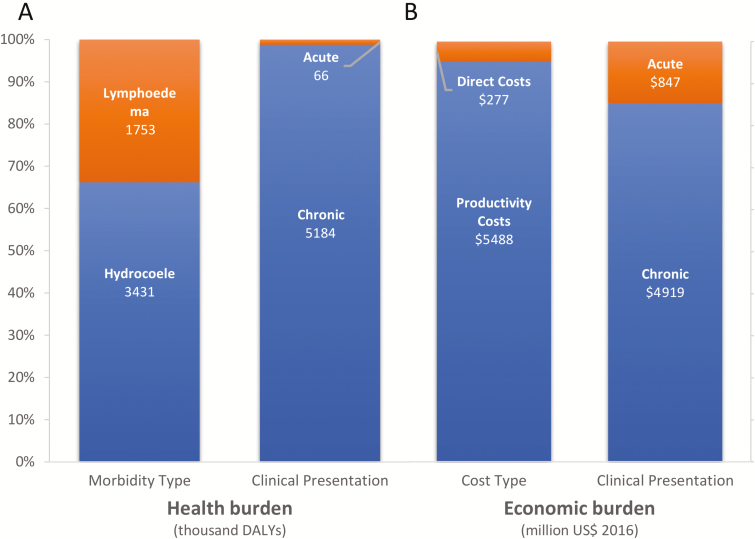
Figure 2.
The (A) health and (B) economic burdens, stratified by morbidity/cost type and clinical presentation. A breakdown of the DALY and economic burden estimates are shown in Supplementary Tables S2, S5, and S7. Results are in 2016 US$. Abbreviation: DALY, disability-adjusted life years.

