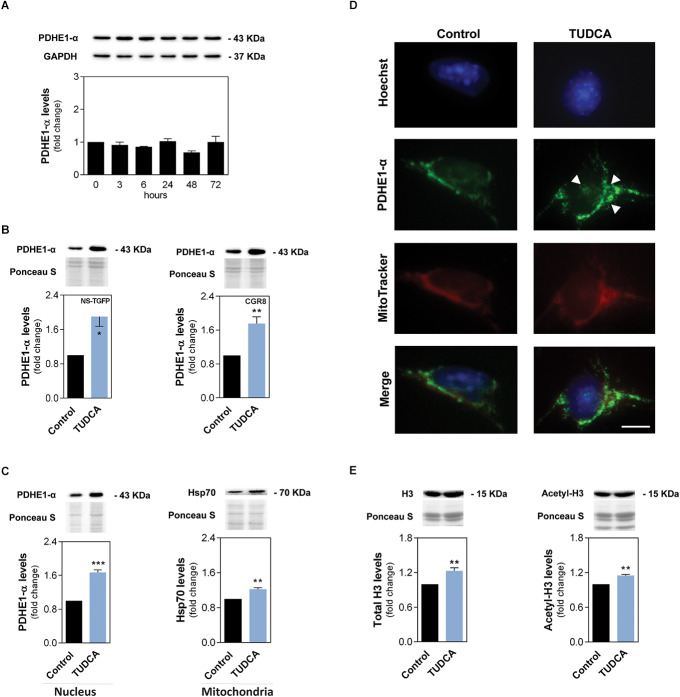
FIGURE 4.
TUDCA increases mitochondrial and nuclear levels of PDHE1-α in NSCs while supporting acetylation of increased H3. The NSC line NS-TGFP was induced to differentiate for up to 72 h and the total protein collected for immunoblotting analysis. Early-differentiating NSCs were also incubated with TUDCA for 24 h and collected for Western blot and immunocytochemistry, as described in Materials and Methods. (A) Representative immunoblots of total PDHE-1α levels (top) and corresponding densitometry analysis (bottom) in NSCs throughout differentiation. Total PDHE-1α levels were normalized to GAPDH. Data are expressed as mean ± SEM fold-change for at least three independent experiments. (B) Representative immunoblots of PDHE1-α levels (top) and corresponding densitometry analysis (bottom) in mitochondrial protein extracts of NS-TGFP and CGR8 cell lines. (C) Representative immunoblots of PDHE1-α (right) and Hsp70 (left) levels (top) and corresponding densitometry analysis (bottom) in nuclear and mitochondrial protein extracts, respectively. (D) Representative images of immunofluorescence detection of cells labeled with an anti-PDHE1-α antibody (green). Nuclei were stained with Hoechst 33258 (blue) and mitochondria with Mitotracker (red). Scale bar, 20 μm. (E) Representative immunoblots of total H3 (left) and acetyl-H3 (right) levels (top) and corresponding densitometry analysis (bottom) in purified histone extracts from NS-TGFP cells. Specific mitochondrial and histone protein levels were normalized to Ponceau S. Data are expressed as mean ± SEM fold-change for at least three independent experiments. *p < 0.05, **p < 0.01, ***p < 0.001 from control (untreated cells).

