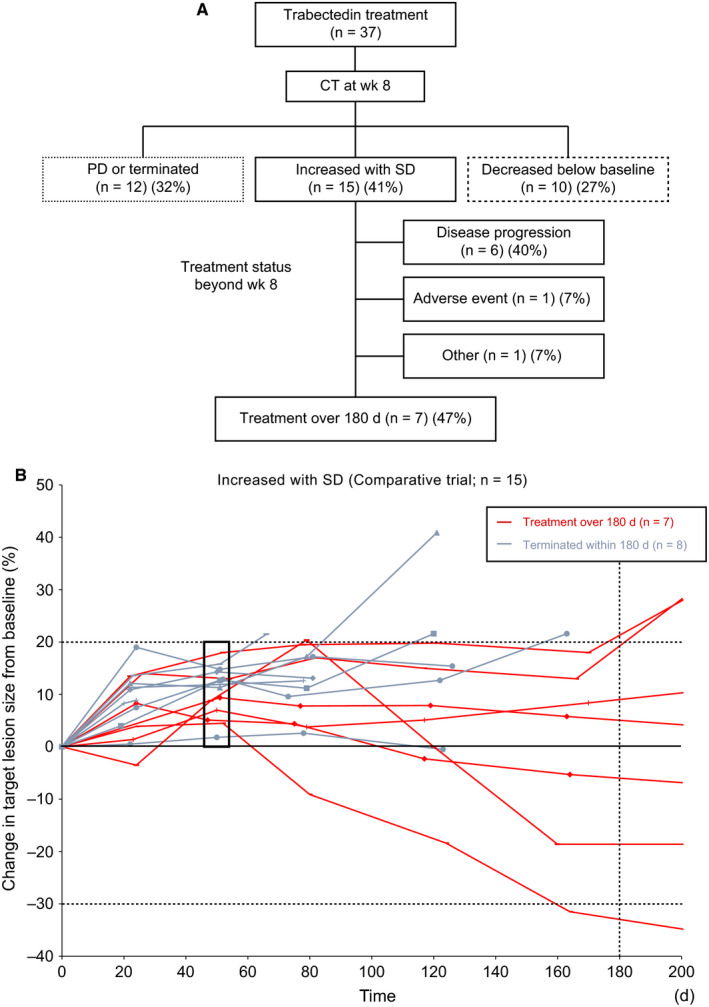
Figure 4.

A, Classification based on the change in tumor size on CT at week 8 (n = 37). For the patients with tumor size “increased within SD (stable disease)”, the treatment status beyond week 8 is also shown. B, Time lapse analysis of tumor size limited to the patients with tumor size “increasing within SD” at week 8 (n = 15)
