
Figure 1.
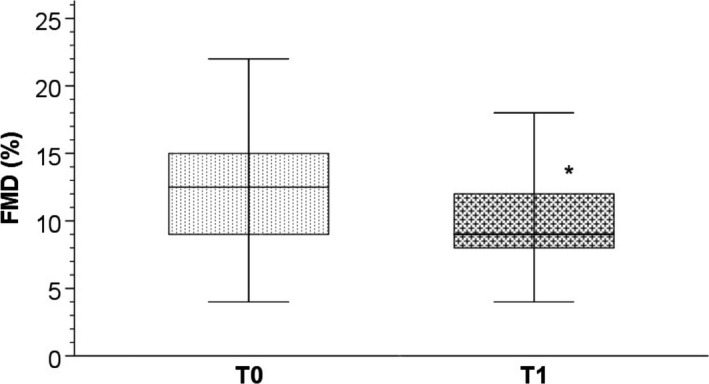
Bar charts with error bars. The median FMD (%) value was significantly higher at T0 with respect to T1 (12.5 (9.25; 15) vs 9 (8; 11.5); * P = .001). Boxes represent means; error bars indicate ± 1 SD. Abbreviations: FMD, flow mediated dilation; SD, standard deviation; T0, baseline; T1 after 40 days of sunitinib treatment