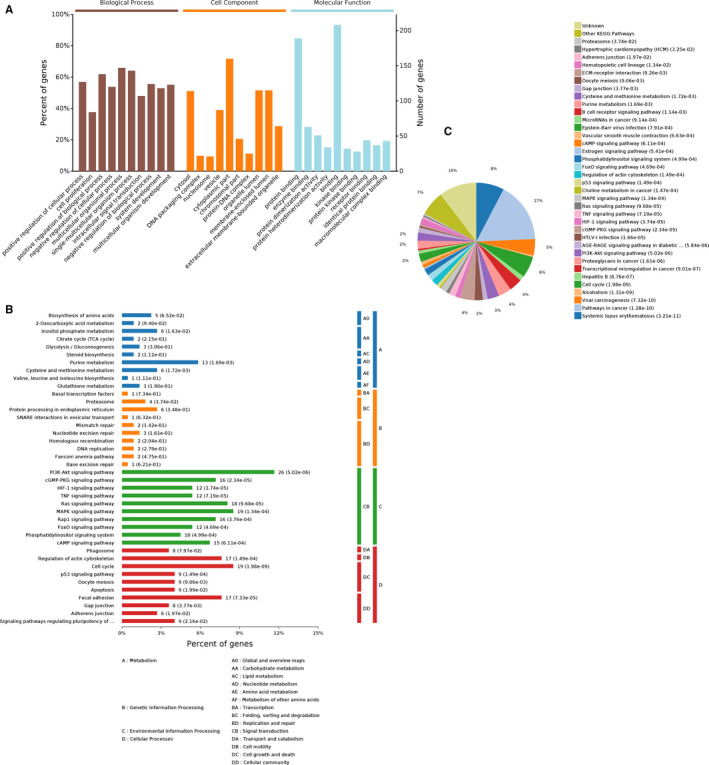
FIGURE 3.

GO and KEGG pathway analyses for the intersecting target DE genes. (A) GO annotation with the top 10 enrichment scores, covering the aspects of biological process, cellular component, and molecular function, respectively. (B) The relevant significantly enriched pathways were determined for these DEmRNAs. And pathways are shown according to the following subcategories: Metabolism, Genetic Information Processing, Environmental Information Processing, Cellular Processes. (C) A pie graph is distinguished into “slices” percentage corresponding to the kegg categories to the exhibited. GO, Gene Ontology; KEGG, Kyoto Encyclopedia of Genes and Genomes; DE, differentially expressed
