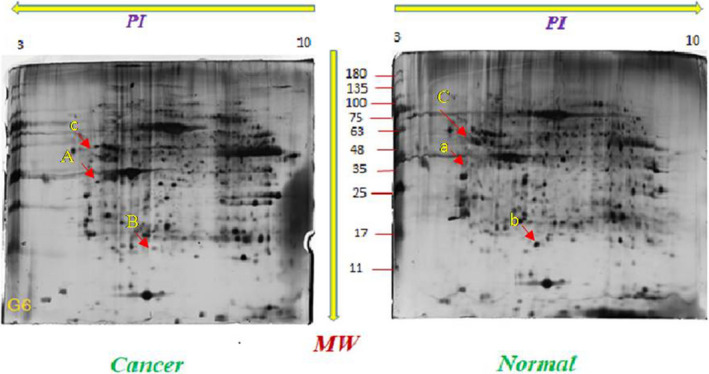
FIGURE 1.

The pattern of polypeptide spot in 70% (or more) of the second‐dimension gel of the patients’ cancerous tissue showed increasing or decreasing expression compared to normal tissue is observed. Arrows and numbers indicate downregulated proteins compared to their matched tumor tissue. Qualified changes is determined by A, B, and C. A molecule has upregulated, whereas B and C molecules have downregulated
