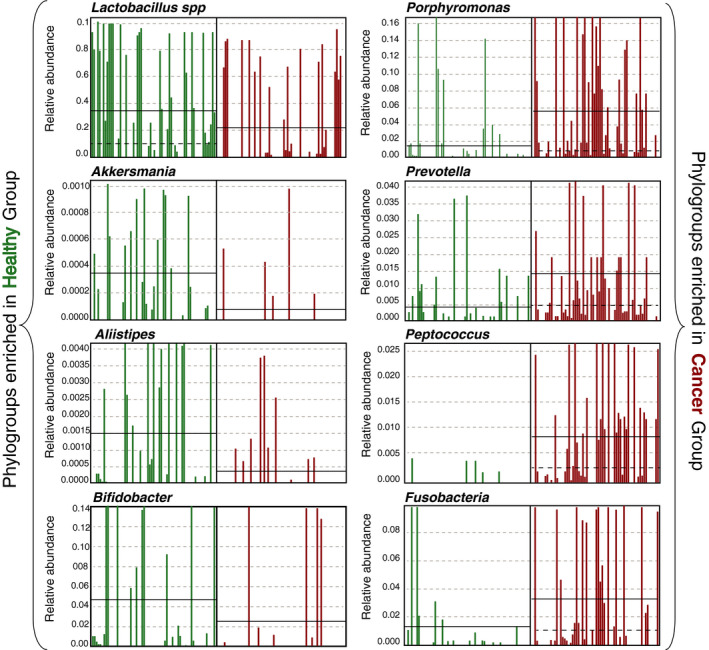
FIGURE 4.

Detection of discriminative phylogroups in healthy vs cancer cohort. The plot compares the estimated relative abundance of eight selected operational taxonomic units discriminative of healthy (Lactobacillus, Allistipes, Akkersmania, and Bifidobacter) or GynCa groups (Prevotella, Porhyromonas, Fusobacteria, and Peptococcus). Continuous black lines correspond to the estimated mean relative abundances while striped black lines depict the median
