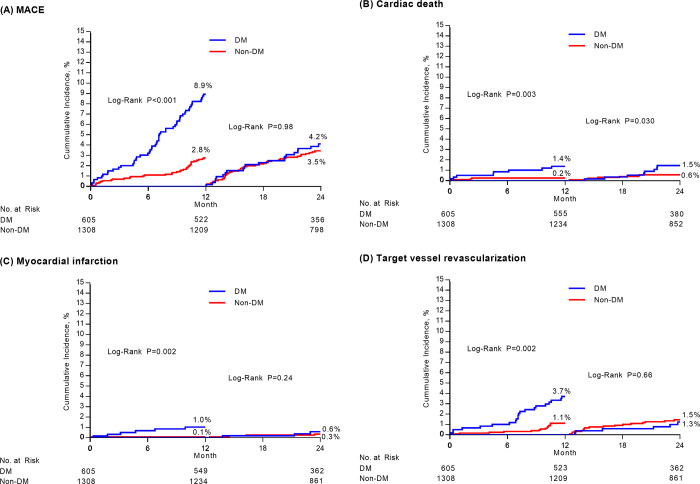
Fig 2. Kaplan-Meier landmark curves between 0 and 1 years and 1 and 2 years according to diabetes mellitus.
In each figure, cumulative-incidence curves are shown for major adverse cardiac events (MACE) stratified by diabetes mellitus (Panel A), cardiac death (Panel B), myocardial infarction (Panel C), and target vessel revascularization (Panel D). MACE was defined as a composite of death from any causes, myocardial infraction, or repeat revascularization.

