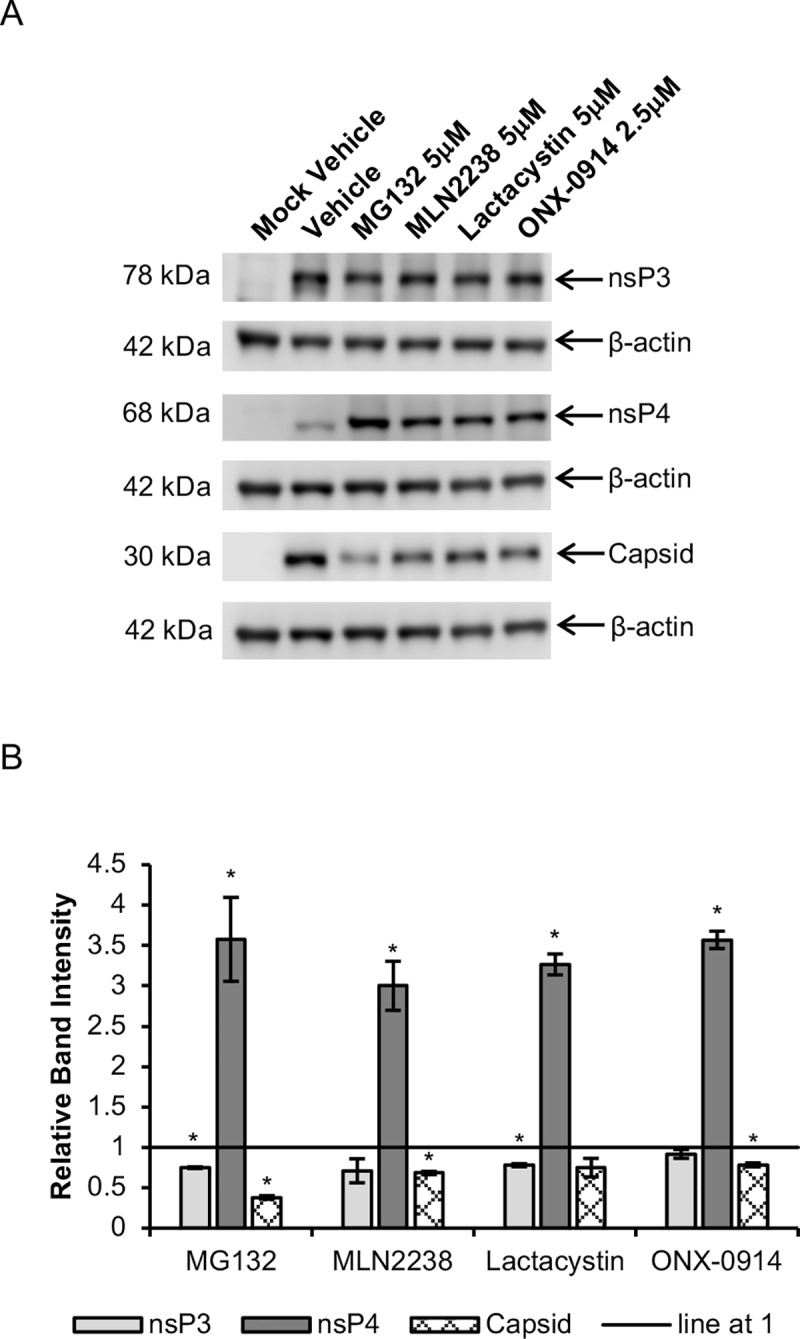
Fig 7. Changes in CHIKV protein levels upon treatment with various proteasome inhibitors at 6 hpi.

HeLa cells were infected with CHIKV-122508 and treated with various proteasome inhibitors at the indicated concentrations or vehicle control. Protein samples were harvested at 6 hpi and probed for CHIKV proteins. (A) Western blot images are representative of two independent experiments. Actin was added as a loading control. NsP4 and capsid were probed on the same blot and share the same actin bands. (B) Band intensities of proteasome inhibitor-treated samples relative to vehicle control are presented in the bar graph. Band intensities were calculated after normalisation with actin for each sample. Error bars represent standard error of means from two independent experiments. * P < 0.05 (Welch’s t-test comparing proteasome inhibitor-treated samples to vehicle control for each CHIKV protein).
