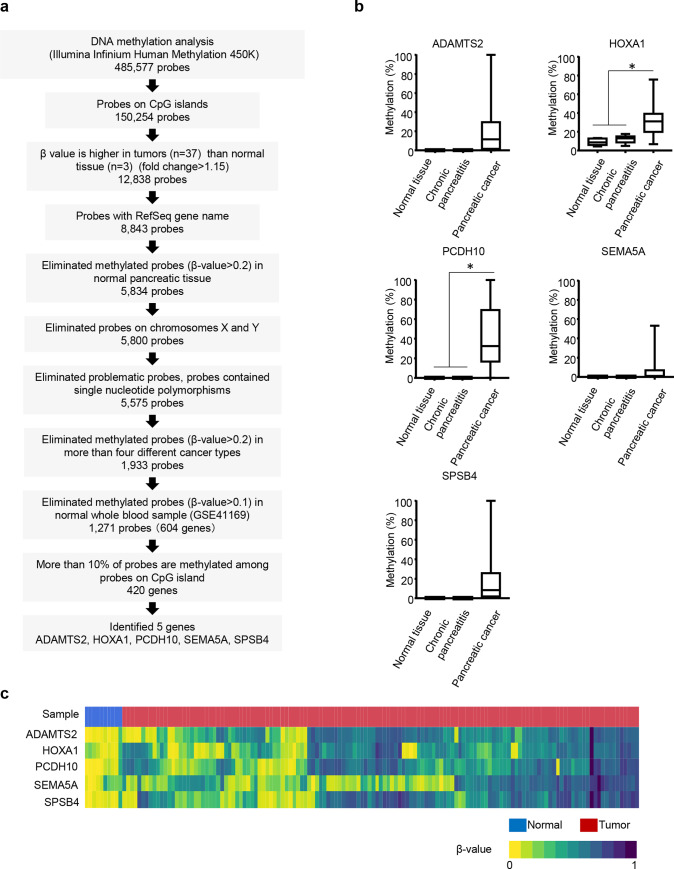
Fig 1. Methylation status of five marker genes in pancreatic cancer tissue.
(a) Schema of how we identified five marker genes from methylation analysis of Illumina Infinium HM450. (b) Methylation level of five markers in normal (n = 5), chronic pancreatitis (n = 6), and pancreatic tumor (n = 22) tissues. DNA methylation levels of each gene are indicated on the y-axis. The median is indicated by a bold line inside the box whose ends denote the upper and lower quartiles. Error bars represent the 5 and 95 percentile values. *, P<0.05. (c) A heatmap of five methylation markers in The Cancer Genome Atlas (TCGA) sample, normal tissue (n = 10) and pancreatic tumor tissues (n = 137). Colors correspond to β-values as indicated (zero means a site is completely unmethylated while one means it is completely methylated). In the sample column, blue and red indicated normal and cancer tissues, respectively.

