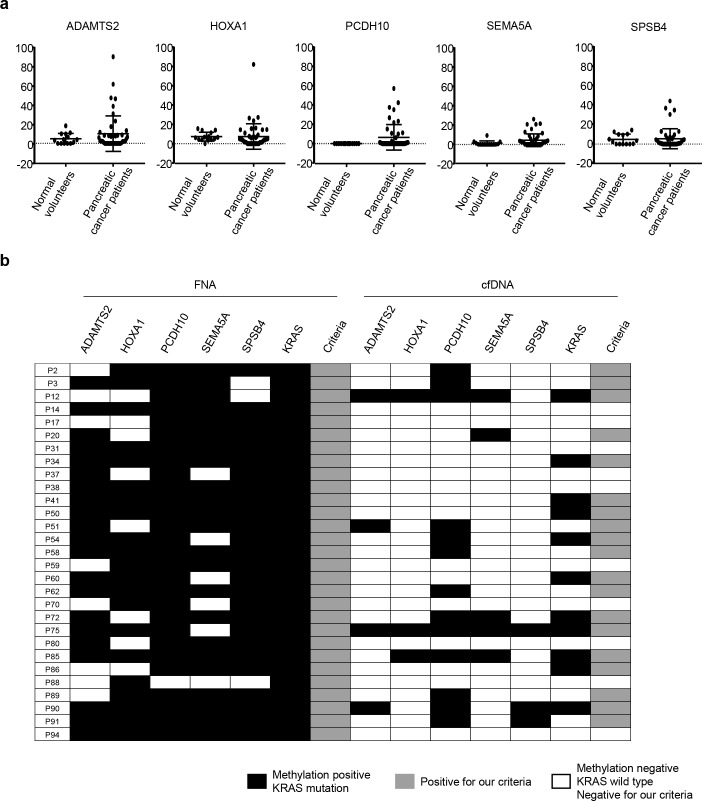
Fig 3. Methylation status of the five marker genes in cfDNA analyzed by MBD–ddPCR.
(a) Methylation level of five markers in cfDNA from normal health controls (n = 14) and patients with pancreatic cancer (n = 47). DNA methylation levels of each gene are indicated on the y-axis. Horizontal lines represent the mean and error bars represent standard deviation. (b) Methylation and KRAS mutation status of paired samples of fine needle aspiration (FNA) and cfDNA (n = 29). The methylation status of FNA samples was analyzed by pyrosequencing or qMSP. The methylation status of cfDNA was analyzed by MBD–ddPCR. Black boxes, methylation or KRAS mutation positive; gray boxes, positive in our criteria (at least one methylation marker or KRAS mutation positive); white boxes, methylation or KRAS mutation negative or negative in our criteria.

