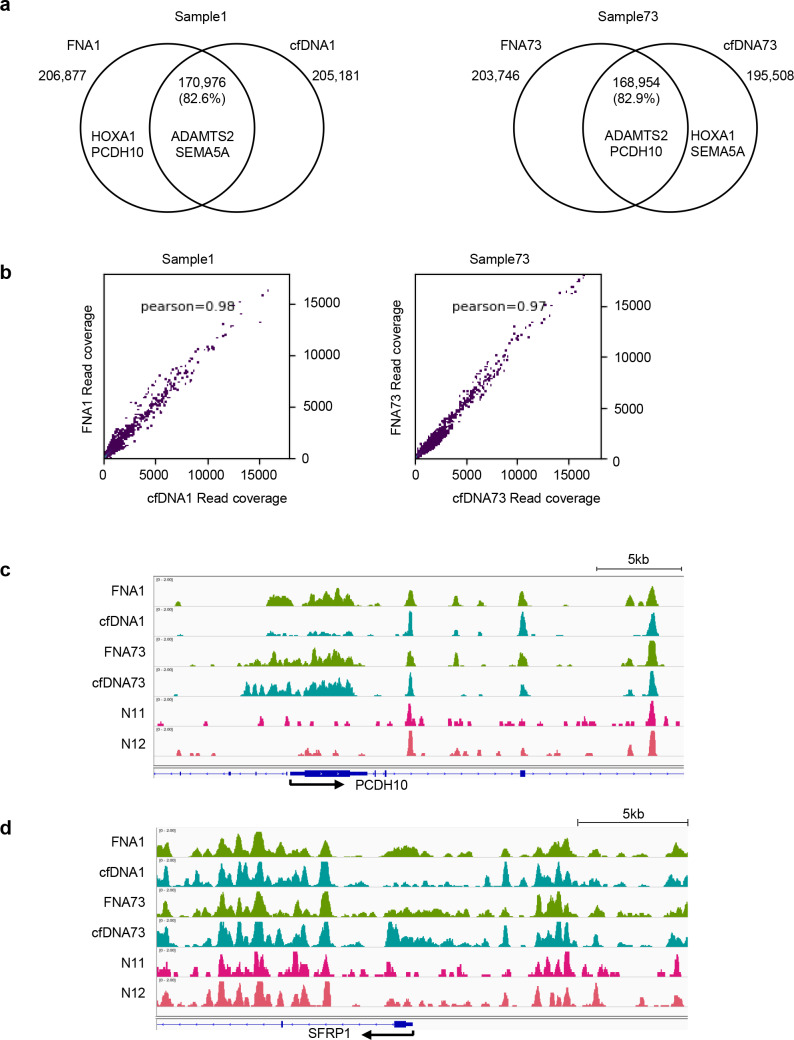
Fig 4. MBD-seq analysis of FNA and paired cfDNA samples.
(a) Venn diagram showing overlap of methylation peaks from fine-needle aspiration (FNA) of pancreatic cancer and cfDNA samples from the same patient. The gene names in the circle indicate that their methylation peaks were identified in each sample. (b) Genome-wide correlation between FNA and cfDNA profiles. Pearson's correlation coefficient, r, is shown in the graph. (c, d) Visualization of MBD–seq data in Integrative Genome Viewer (IGV). (c) The promoter region of PCDH10, (d) the promoter region of SFRP1. N11 and N12 are cfDNA samples from normal healthy controls.

