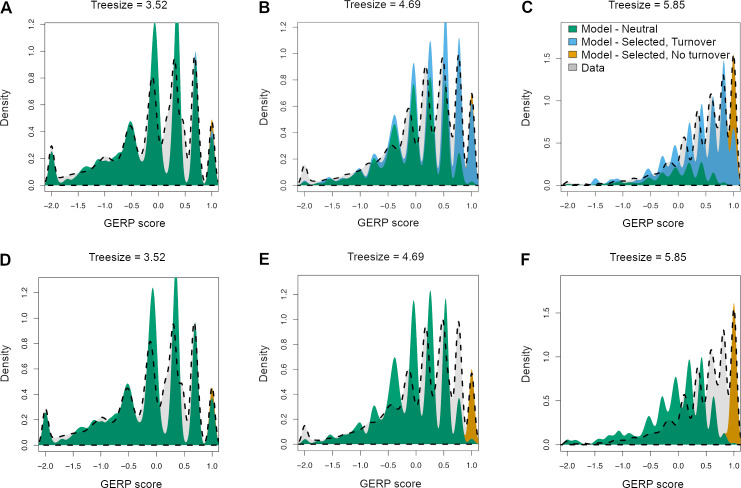
Fig 5. Fit of models of purifying selection to the empirical GERP score distribution for different tree depths.
Dashed gray lines indicate the empirical distribution of GERP scores. The 3 plots in each row denote the distributions for different depths in the multi-species sequence alignment. The GERP scores were normalized by dividing each score by the largest possible score given the tree size (see Methods). (A-C) Fit of a model with 3 categories of sites: neutral, selected, and turnover (see text). (D-F) Fit of a model with 2 categories of sites: neutral and selected. Note that the model with turnover provides a more satisfactory fit to the empirical data.

