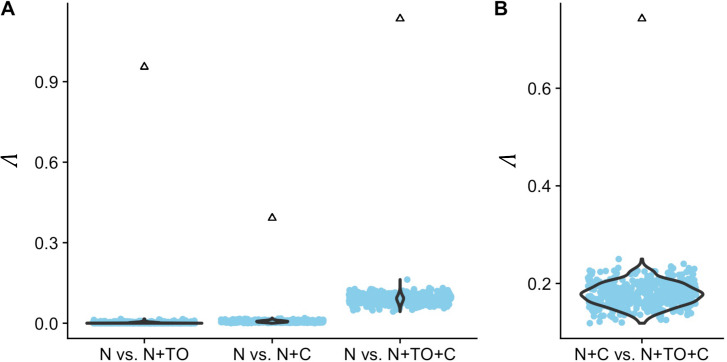
Fig 7. The observed values of Λ fall outside the null distributions.
The null distribution (blue points) is derived from 500 simulations under the respective null model, i.e. assuming only neutral sites in (A) and neutral plus constantly selected sites in (B). The triangles denote the empirically observed statistics. In all cases, the null hypothesis is rejected with p<0.01.

