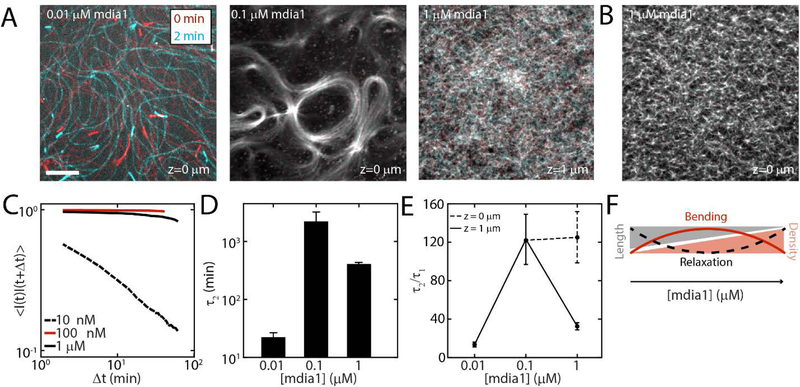
Figure 4. F-actin nucleation differentially mediates timescales of relaxation and turnover.
(A) Fluorescence image of F-actin at 0 min (red) and 2 min (cyan) for mdia1=10 nM (left), 100 nM (middle) and 1 μM (right) indicate motion of F-actin with time. Scale bar is 10 μm. (B) Color overlay for 1 μM F-actin at z=0 μm shows immobile F-actin. (C) Autocorrelation decay of fluorescence intensity and viscoelastic timescale τ2. (D) Mean exponential timescale, τ2 as a function of formin concentration (N = 3, 4, and 3 for 10 nM, 100 nM, and 1μM respectively). (E) Relaxation timescale divided by turnover timescale indicates the extent to which mechanical relaxation is induced by chemical turnover. The dashed line depicts the response of 1 μM network at z = 0 μm. The correlation timescales are significantly larger closer to surface due to possible tethering of filaments to formin nucleators. (F) Schematic of the relationship between geometric parameters, bending energy and timescales of relaxation.

