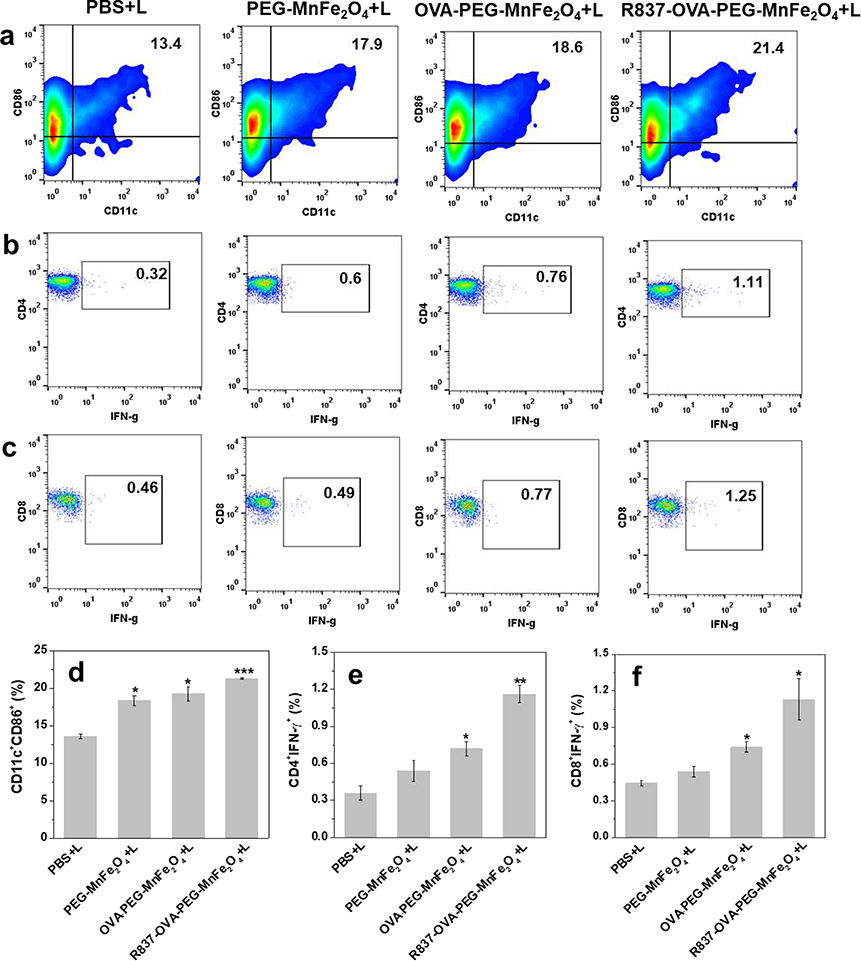
Fig.6.
(a, d) Maturation of DCs in lymph nodes (%) on day 3 after different treatments. (b, e) Representative flow plots used to evaluate frequency of IFN-γ producing CD4 T cells taken from splenocytes of animals on day 7 after various treatments. (c, f) Representative flow plots used to evaluate frequency of IFN-γ producing CD8 T cells taken from splenocytes of animals on day 7 after various treatments (n = 3, *P < 0.05, **P < 0.01, vs. PBS plus laser irradiation group).

