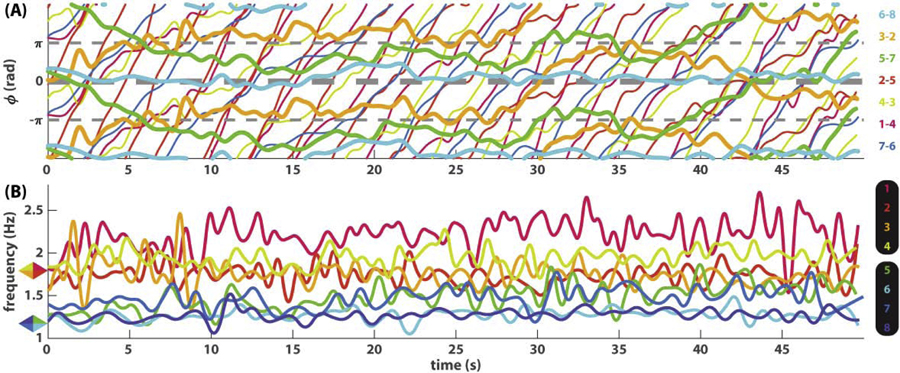
Fig 2. An example of eight-agent coordination dynamics shown as seven pairwise relative phases (A) and eight instantaneous frequency trajectories (B).
In (A), slowly varying phase relations are shown as thick lines (orange trajectory 3–2, green 5–7, cyan 6–8), whereas fast varying phase relations are shown as thin lines with much steeper slopes than the thick lines. In (B), the corresponding frequency trajectories indicate that frequency diversity is much greater than in Fig 1B. Because agents were paced with two different metronomes prior to interaction (1.2 and 1.8 Hz, marked by colored rhombi on the left), the ensemble of eight starts off as two frequency groups, one in warm colors (1, 2, 3, 4) and one in cold colors (5, 6, 7, 8). Toward the end of the trial, members from the two groups begin to mingle.

